XactInsights frequently asked questions
We are excited to introduce XactInsights! Below are answers to some of the questions that you might have.
Who, what, where, and how?
Who will have access to this feature?
XactInsights is available for all XactAnalysis users. However, XactInsights will first need to be added to your account, and then your users will need to be granted access rights by an admin user. XactInsights is not currently available for XactAnalysis QR or XactAnalysis SP.
Is this data real-time?
The data in XactInsights is captured in the early morning hours of each day. This means that it will have all data up until the current day, but it will not include changes made during that day.
Where is XactInsights in the application?
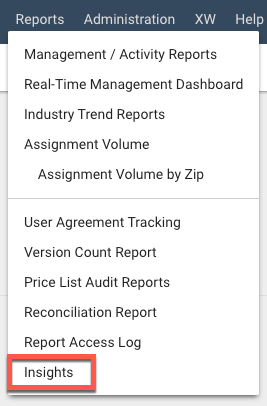
You can find XactInsights in the Reports menu if it has been added to your account and you have the appropriate user rights.

How do I get access to XactInsights?
Please contact your Xactware account manager to subscribe to XactInsights. If your account has already subscribed to XactInsights, please contact your internal account admin to grant you the appropriate user rights.
Authors and viewers
What is the difference between an author and a viewer?
An author has access to all the features and tools in XactInsights. A viewer can see the Overview and Liveboards tabs, but they cannot create or edit any liveboards.
How do I make a user on my account an author or a viewer?
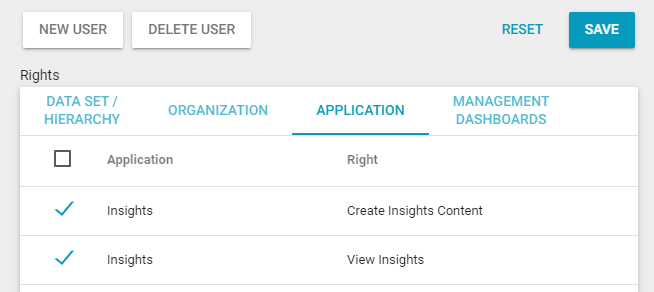
If you’re an admin user, you can grant author and viewer rights to your users via the User Administration page. In the User Rights, select the XactInsights application right. To make a user an author, make sure to select both XactInsights rights.

How many authors can an account have?
The default limit of authors for an account is three. If you pay for 25 months of data, that number automatically goes up to six. You also can pay for additional authors.
There is no limit for the number of viewers your account can have.
How do I increase the author limit for my account?
Please contact your Xactware account manager to increase your author limit.
Searches and answers
What is an answer?
The results of your searches are called answers. You can save answers to the Answers tab, add them to liveboards, and share them with other users. You can also make edits to your answers any time you want.
My answer is a table, but I wanted a chart. How do I change it?
You can change between the table and chart views with the switch  on the top right corner of the answer.
What if I want to change the type of chart that my data is displayed in?
XactInsights automatically displays your data in the type of chart that we think is best suited for your criteria. However, you can change the chart type by clicking Change visualization  and selecting a new chart type from the selection that appears.
Liveboards
What is a liveboard?
Liveboards are dashboards where you can collect related charts and tables. You can click-and-drag a chart to position it on the liveboard.
How do I create a liveboard?
- In XactInsights, click the Liveboards tab.
- Click
 . The New Liveboard window will appear.
 - Enter a name and description for your liveboard.
- Click Create.
How do I save something to a liveboard?
You can save answers from your search to a liveboard.
- On the answer, click
 . The Add to Liveboard window will appear.
 - Click the name of the liveboard that you want to add your answer to.
- You can also click Create Liveboard if you have not already created the liveboard. You can then add your answer to the newly created liveboard.
- Click Pin.
Miscellaneous
What is SpotIQ?
SpotIQ helps you view your data’s trends, outliers, and correlations. This feature runs automatically, but you can also focus it to better meet your needs.
Help! I went to XactInsights, but there’s no data!
If you’ve already set up your XactInsights account with the help of your account manager, but you still don’t see any data, you probably need to select a data source:
- Click in the Search your data field.
- Under Data, click Choose Sources.
- Select the data source that you want to explore in XactInsights.
How can we provide feedback on what we’d like to include in XactInsights?
We look forward to hearing any suggestions that you have about XactInsights. We recommend using the Feedback option within XactAnalysis, which you can find under the Help menu.
