Industry Trend Reports
Industry trend reports display various material and labour costs across the entire industry. These graphical, interactive reports are regularly updated with researched pricing data to give you an accurate and current outlook on trends.
The screenshots in this document are generic, and your company’s interface may vary.
Related: Assignment Volume Report, Management/Activity Reports
View Industry Trend Reports
- Select Industry Trend Reports from the Reports menu. This takes you to the Industry Trend Reports page. The All Trends report is displayed by default.
- Click the Report menu and select the Industry Trend report that you want to view.
- By default, the reports display information based on every available geographic location. To change a report so it reflects a specific location, drill down in the hierarchy tree to the left of the report and select a location.
Reports
All Trends Report
This report is the default report displayed when you first open the Industry Trend Reports page (see image above). It displays all of the other industry trend reports and their percent of price change over a specified number of years
Several features are available with this report:
Individual Report Navigation
You can navigate to any of the individual reports by clicking on either their bar in the graph or their name in the data list beneath.
Display Report Data From
This menu allows you to change the span of time displayed in the report. You can choose from the past one to five years.
Show Hierarchy
Clear this check box to hide the location hierarchy on the left of the graph.
Show Data Table
Clear this check box to hide the data table below the graph.
Export to Excel
Click Export to Excel to export the data from the report into an Excel® spreadsheet.
Back
Click Back to return to previously viewed reports.
Printable View
Click Printable View to open a new window with a printer-friendly version of the graph and data.
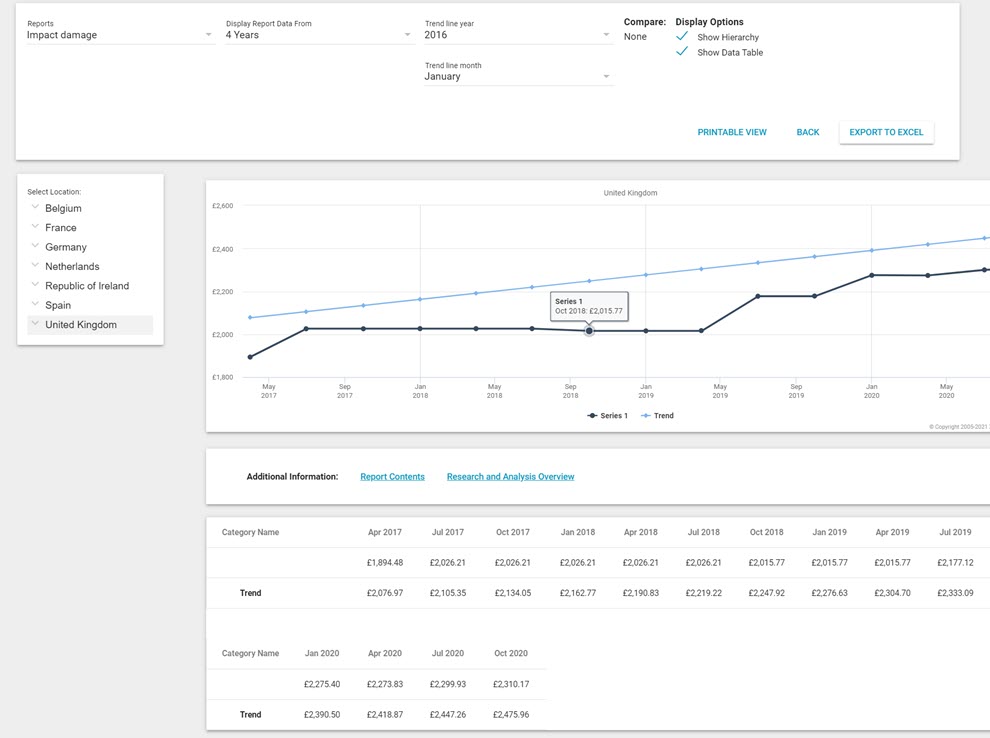
Impact Damage Report
This report displays the monthly changes in value of materials used to repair or replace impact damage over a specified number of years. All data in this report is based on building cost data published by Xactware.

Several features are available with this report:
Display Report Data From
This menu allows you to change the span of time displayed in the report. You can choose from the past one to five years.
Trend Line Year
Select a year from this menu to add a line on the graph that represents that year’s industry trend. After selecting a year, a second menu appears that allows you to select a month or quarter of that year from which to start the trend line.
Compare
If you drill down in the hierarchy tree to a location below the national level, one or both of the Compare check boxes become available. When selected, additional plot lines are added to the graph that represent the national or state average.
Show Hierarchy
Clear this check box to hide the location hierarchy on the left of the graph.
Show Data Table
Clear this check box to hide the data table below the graph.
Export to Excel
Click Export to Excel to export the data from the report into an Excel® spreadsheet.
Back
Click Back to return to previously viewed reports.
Printable View
Click Printable View to open a new window with a printer-friendly version of the graph and data.
Report Contents
Click this link to open a new window that displays all of the Xactimate price list items that were tracked for this report.
Research and Analysis Overview
Click this link to open a new window that explains how Xactware researches and updates the prices for its price lists.
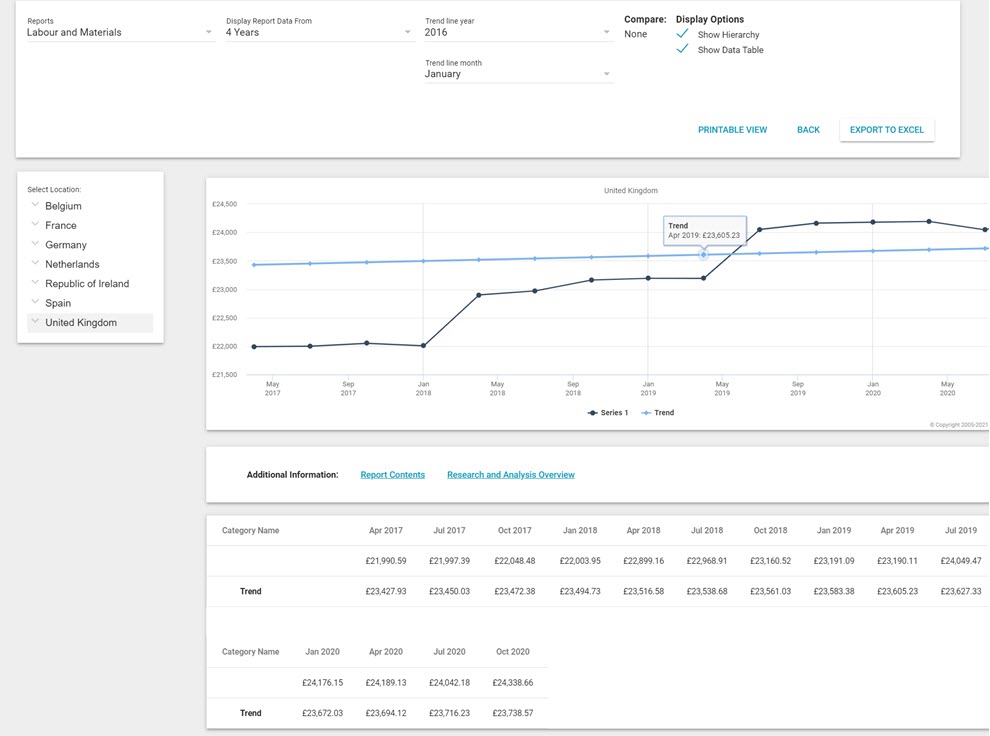
Labour and Materials Report
This report displays the monthly changes in value of labour and materials over a specified number of years. All data in this report is based on building cost data published by Xactware.

Several features are available with this report:
Display Report Data From
This menu allows you to change the span of time displayed in the report. You can choose from the past one to five years.
Trend Line Year
Select a year from this menu to add a line on the graph that represents that year’s industry trend. After selecting a year, a second menu appears that allows you to select a month or quarter of that year from which to start the trend line.
Compare
If you drill down in the hierarchy tree to a location below the national level, one or both of the Compare check boxes become available. When selected, additional plot lines are added to the graph that represent the national or state average.
Show Hierarchy
Clear this check box to hide the location hierarchy on the left of the graph.
Show Data Table
Clear this check box to hide the data table below the graph.
Export to Excel
Click Export to Excel to export the data from the report into an Excel® spreadsheet.
Back
Click Back to return to previously viewed reports.
Printable View
Click Printable View to open a new window with a printer-friendly version of the graph and data.
Report Contents
Click this link to open a new window that displays all of the Xactimate price list items that were tracked for this report.
Research and Analysis Overview
Click this link to open a new window that explains how Xactware researches and updates the prices for its price lists.
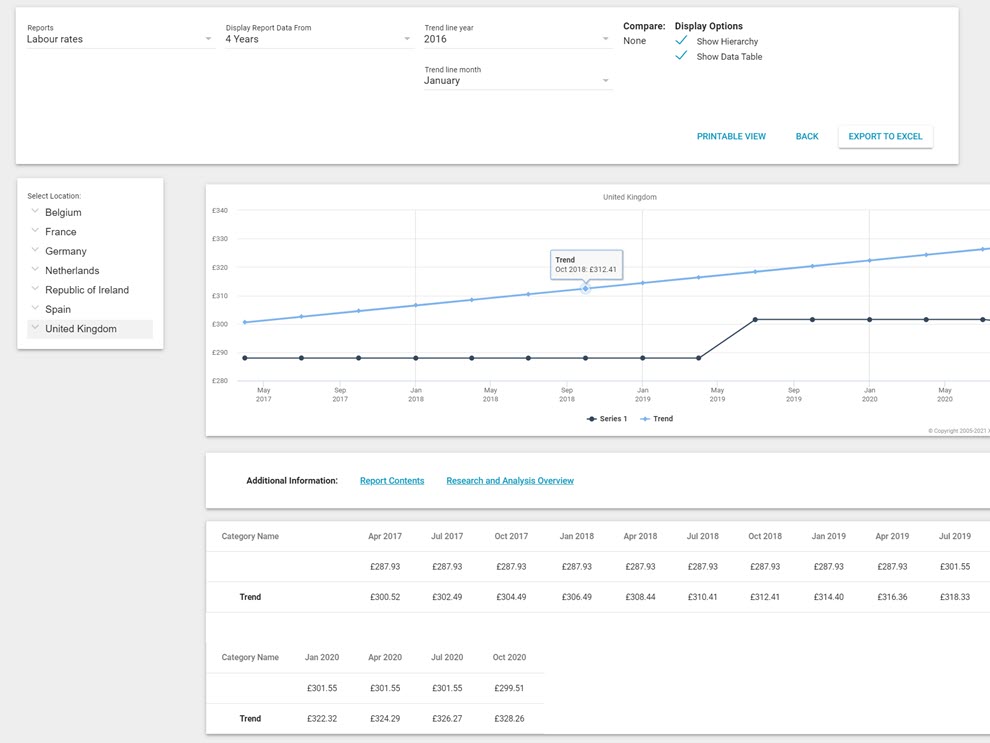
Labour Rates Report
This report displays the monthly changes in value of labour over a specified number of years. All data in this report is based on building cost data published by Xactware.

Several features are available with this report:
Display Report Data From
This menu allows you to change the span of time displayed in the report. You can choose from the past one to five years.
Trend Line Year
Select a year from this menu to add a line on the graph that represents that year’s industry trend. After selecting a year, a second menu appears that allows you to select a month or quarter of that year from which to start the trend line.
Compare
If you drill down in the hierarchy tree to a location below the national level, one or both of the Compare check boxes become available. When selected, additional plot lines are added to the graph that represent the national or state average.
Show Hierarchy
Clear this check box to hide the location hierarchy on the left of the graph.
Show Data Table
Clear this check box to hide the data table below the graph.
Export to Excel
Click Export to Excel to export the data from the report into an Excel® spreadsheet.
Back
Click Back to return to previously viewed reports.
Printable View
Click Printable View to open a new window with a printer-friendly version of the graph and data.
Report Contents
Click this link to open a new window that displays all of the Xactimate price list items that were tracked for this report.
Research and Analysis Overview
Click this link to open a new window that explains how Xactware researches and updates the prices for its price lists.
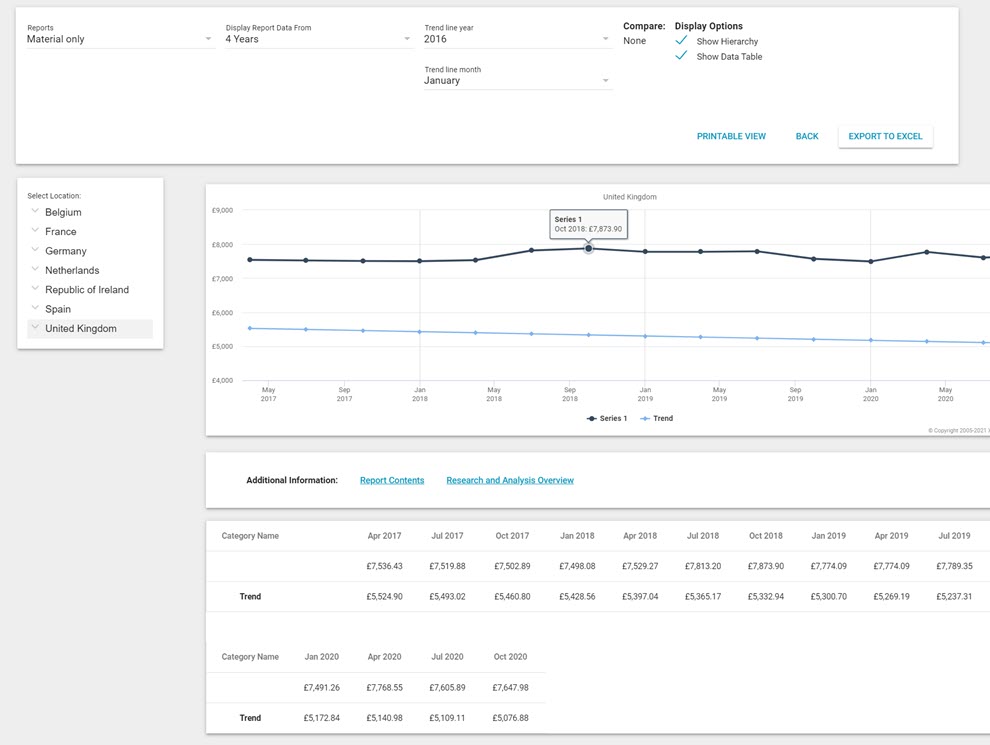
Material Only Report
This report displays the monthly changes in value of materials over a specified number of years. All data in this report is based on building cost data published by Xactware.

Several features are available with this report:
Display Report Data From
This menu allows you to change the span of time displayed in the report. You can choose from the past one to five years.
Trend Line Year
Select a year from this menu to add a line on the graph that represents that year’s industry trend. After selecting a year, a second menu appears that allows you to select a month or quarter of that year from which to start the trend line.
Compare
If you drill down in the hierarchy tree to a location below the national level, one or both of the Compare check boxes become available. When selected, additional plot lines are added to the graph that represent the national or state average.
Show Hierarchy
Clear this check box to hide the location hierarchy on the left of the graph.
Show Data Table
Clear this check box to hide the data table below the graph.
Export to Excel
Click Export to Excel to export the data from the report into an Excel® spreadsheet.
Back
Click Back to return to previously viewed reports.
Printable View
Click Printable View to open a new window with a printer-friendly version of the graph and data.
Report Contents
Click this link to open a new window that displays all of the Xactimate price list items that were tracked for this report.
Research and Analysis Overview
Click this link to open a new window that explains how Xactware researches and updates the prices for its price lists.
Small Bathroom Water Loss Report
This report displays the monthly changes in value for a group of common materials and labor associated with water loss in a small bathroom. These changes are shown over a specified number of years. All data in this report is based on building cost data published by Xactware.
Several features are available with this report:
Display Report Data From
This menu allows you to change the span of time displayed in the report. You can choose from the past one to five years.
Trend Line Year
Select a year from this menu to add a line on the graph that represents that year’s industry trend. After selecting a year, a second menu appears that allows you to select a month or quarter of that year from which to start the trend line.
Compare
If you drill down in the hierarchy tree to a location below the national level, one or both of the Compare check boxes become available. When selected, additional plot lines are added to the graph that represent the national or state average.
Show Hierarchy
Clear this check box to hide the location hierarchy on the left of the graph.
Show Data Table
Clear this check box to hide the data table below the graph.
Export to Excel
Click Export to Excel to export the data from the report into an Excel spreadsheet.
Back
Click Back to return to previously viewed reports.
Printable View
Click Printable View to open a new window with a printer-friendly version of the graph and data.
Report Contents
Click this link to open a new window that displays all of the Xactimate price list items that were tracked for this report.
