Industry Trend Reports
 Updated
by
Arianne G.
Updated
by
Arianne G.
- View Industry Trend Reports
- Reports
- All Trends Report
- Average Returned Claim Value Report
- Basket of Goods Labor & Materials Report
- Basket of Goods Material Only Report
- Carpet Material Composite Report
- Carpet Replacement—Material and Labor Report
- Contents Packout & Cleaning Report
- Drywall Material Composite Report
- Fire Damage—Medium Size Report
- Garage Door Replacement—Mat. and Labor Report
- Int. Door Replacement—Material and Labor Report
- Interior Trim Material Composite Report
- Kitchen Smoke Damage Report
- Laminated Shingle—Labor & Materials Report
- Lumber Material Composite Report
- Paint Material Composite Report
- Price List Changes Report
- Retail Labor Report
- Individual trade reports available from the Retail Labor report
- Roof 25 yr Shingle—Labor & Materials Report
- Roofing Material Composite Report
- Small Bathroom Water Loss Report
- Small Hail Loss Report
- Small Vandalism Loss Report
- Total Reconstruction Costs By State Report
- Total Reconstruction Costs Vs. Market Value Report
- Water Damage Mitigation Estimate Report
- Wood Floor Refinish—Material and Labor Report
- Year over Year Key Composite Trends by Category Report
- Basket of Goods Labor & Materials
- Basket of Goods Material Only
- Carpet Material Composite
- Carpet Replacement-Material and Labor
- Contents Packout & Cleaning
- Drywall Material Composite
- Fire Damage - Medium Size
- Garage Door Replacement-Mat. and Labor
- Int. Door Replacement-Material and Labor
- Interior Trim Material Composite
- Kitchen Smoke Damage
- Lumber Material Composite
- Paint Material Composite
- Retail Labor
- Retail Labor Definitions
- Roof 25 yr Shingle - Labor & Materials
- Roofing Material Composite
- Small Bathroom Water Loss
- Small Hail Loss
- Small Vandalism Loss
- Vinyl Flooring Material Composite
- Water Damage Mitigation Estimate
- Wood Floor Refinish-Material and Labor
Industry trend reports display various material and labor costs across the entire industry. These graphical, interactive reports are regularly updated with researched pricing data to give you an accurate and current outlook on trends.
The screenshots in this document are generic, and your company’s interface may vary.
Related: Assignment Volume Report, Management/Activity Reports
View Industry Trend Reports
- Select Industry Trend Reports from the Reports menu.
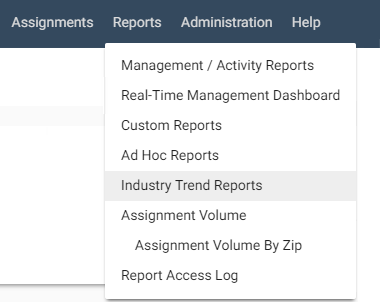
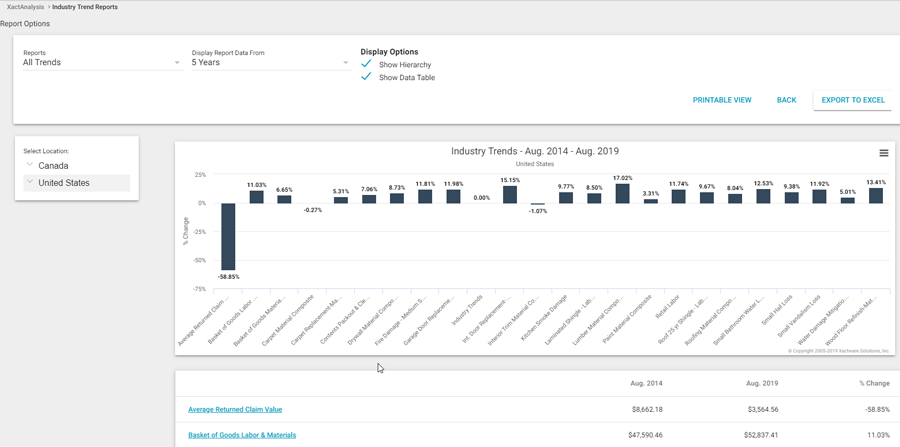
This takes you to the Industry Trend Reports page. The All Trends report is displayed by default.
- Click the Report menu and select the Industry Trend report that you want to view.
- By default, the reports display information based on every available geographic location. To change a report so it reflects a specific location, drill down in the hierarchy tree to the left of the report and select a location.
Reports
All Trends Report
This report is the default report displayed when you first open the Industry Trend Reports page (see image above). It displays all of the other industry trend reports and their percent of price change over a specified number of years
Several features are available with this report:
Individual Report Navigation
You can navigate to any of the individual reports by clicking on either their bar in the graph or their name in the data list beneath.
Display Report Data From
This menu allows you to change the span of time displayed in the report. You can choose from the past one to five years.
Show Hierarchy
Clear this check box to hide the location hierarchy on the left of the graph.
Show Data Table
Clear this check box to hide the data table below the graph.
Export to Excel
Click Export to Excel to export the data from the report into an Excel® spreadsheet.
Back
Click Back to return to previously viewed reports.
Printable View
Click Printable View to open a new window with a printer-friendly version of the graph and data.
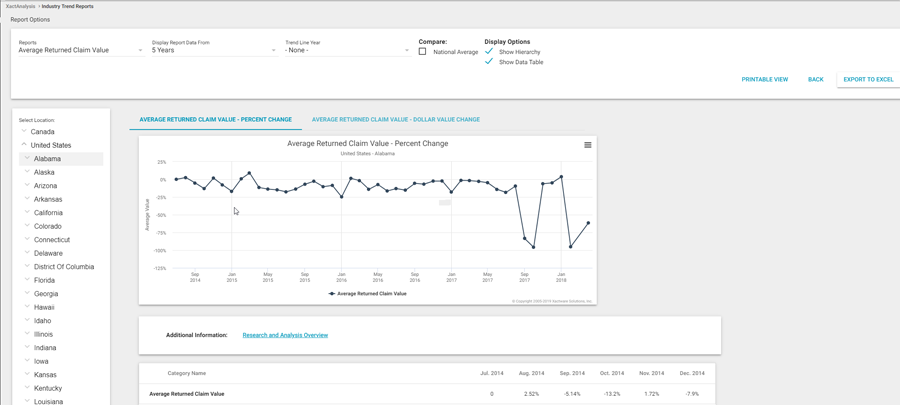
Average Returned Claim Value Report
This report displays the monthly changes in value for returned claims over a specified number of years. All data in this report is based on estimates returned to XactAnalysis®.
Several features are available with this report:
Percent Change
Click this tab, located above the graph, to view the provided data according to the monthly percent of change from the first month listed.
Dollar Value Change
Click this tab, located above the graph, to view the provided data according to the dollar amount change each month.
Display Report Data From
This menu allows you to change the span of time displayed in the report. You can choose from the past one to five years.
Project Trend Line From
Select a year from this menu to add a line on the graph that represents that year’s industry trend. After selecting a year, a second menu appears that allows you to select a month or quarter of that year from which to start the trend line.
Compare
If you drill down in the hierarchy tree to a location below the national level, one or both of the comparison check boxes become available. These boxes add additional plot lines to the graph that represent the national or state average.
Show Hierarchy
Clear this check box to hide the location hierarchy on the left of the graph.
Show Data Table
Clear this check box to hide the data table below the graph.
Export to Excel
Click Export to Excel to export the data from the report into an Excel® spreadsheet.
Back
Click Back to return to previously viewed reports.
Printable View
Click Printable View to open a new window with a printer-friendly version of the graph and data.
Research and Analysis Overview
Click this link to open a new window that explains how Xactware researches and updates the prices for its price lists.
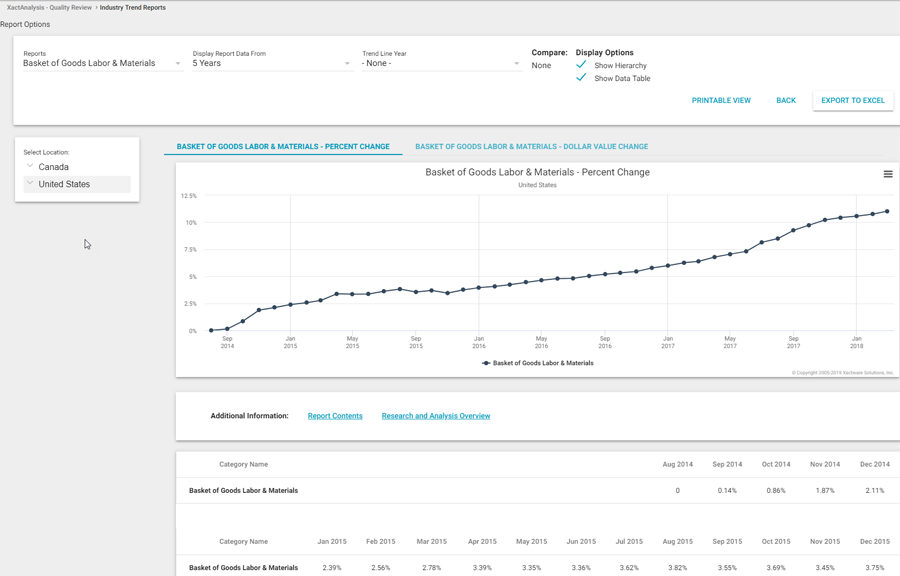
Basket of Goods Labor & Materials Report
This report displays the monthly changes in value of a group of common estimate repair materials and labor over a specified number of years. All data in this report is based on building cost data published by Xactware.
For a list of line items that were tracked for this report, click here.
Several features are available with this report:
Percent Change
Click this tab, located above the graph, to view the provided data according to the monthly percent of change from the first month listed.
Dollar Value Change
Click this tab, located above the graph, to view the provided data according to the dollar amount change each month.
Display Report Data From
This menu allows you to change the span of time displayed in the report. You can choose from the past one to five years.
Project Trend Line From
Select a year from this menu to add a line on the graph that represents that year’s industry trend. After selecting a year, a second menu appears that allows you to select a month or quarter of that year from which to start the trend line.
Compare
If you drill down in the hierarchy tree to a location below the national level, one or both of the Compare check boxes become available. When selected, additional plot lines are added to the graph that represent the national or state average.
Show Hierarchy
Clear this check box to hide the location hierarchy to the left of the graph.
Show Data Table
Clear this check box to hide the data table below the graph.
Export to Excel
Click Export to Excel to export the data from the report into an Excel spreadsheet.
Back
Click Back to return to previously viewed reports.
Printable View
Click Printable View to open a new window with a printer-friendly version of the graph and data.
Report Contents
Click this link to open a new window that displays all of the Xactimate price list items that were tracked for this report.
Research and Analysis Overview
Click this link to open a new window that explains how Xactware researches and updates the prices for its price lists.
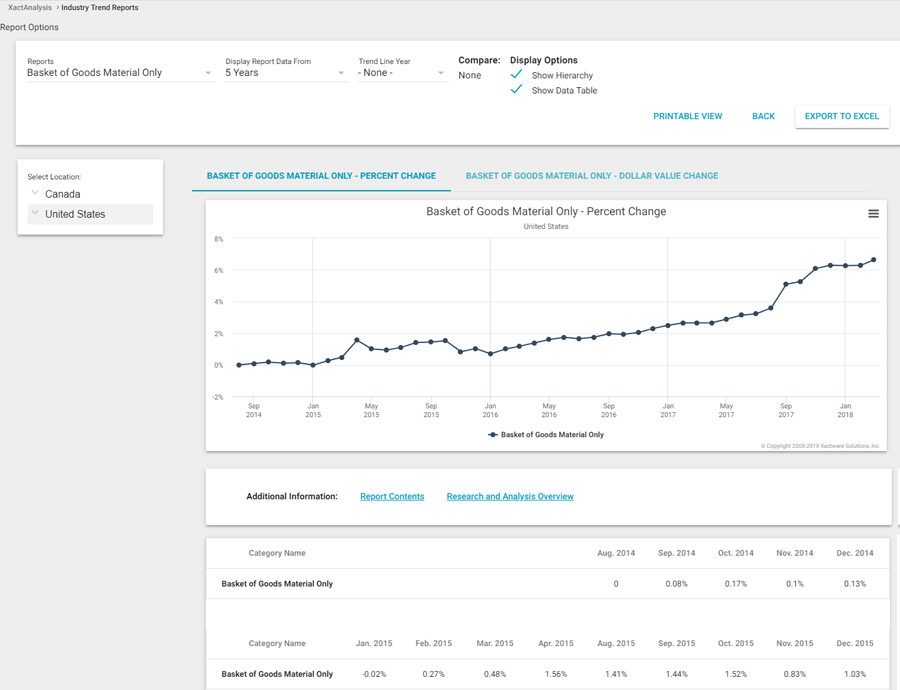
Basket of Goods Material Only Report
This report displays the monthly changes in value of a group of common estimate repair materials over a specified number of years. All data in this report is based on building cost data published by Xactware.
For a list of line items that were tracked for this report, click here.
Several features are available with this report:
Percent Change
Click this tab, located above the graph, to view the provided data according to the monthly percent of change from the first month listed.
Dollar Value Change
Click this tab, located above the graph, to view the provided data according to the dollar amount change each month.
Display Report Data From
Use this menu to change the span of time displayed in the report. You can choose from the past one to five years.
Project Trend Line From
Select a year from this menu to add a line on the graph that represents that year’s industry trend. After selecting a year, a second menu appears that allows you to select a month or quarter of that year from which to start the trend line.
Compare
If you drill down in the hierarchy tree to a location below the national level, one or both of the Compare check boxes become available. When selected, additional plot lines are added to the graph that represent the national or state average
Show Hierarchy
Clear this check box to hide the location hierarchy to the left of the graph.
Show Data Table
Clear this check box to hide the data table below the graph.
Export to Excel
Click Export to Excel to export the data from the report into an Excel spreadsheet.
Back
Click Back to return to previously viewed reports.
Printable View
Click Printable View to open a new window with a printer-friendly version of the graph and data.
Report Contents
Click this link to open a new window that displays all of the Xactimate price list items that were tracked for this report.
Research and Analysis Overview
Click this link to open a new window that explains how Xactware researches and updates the prices for its price lists.
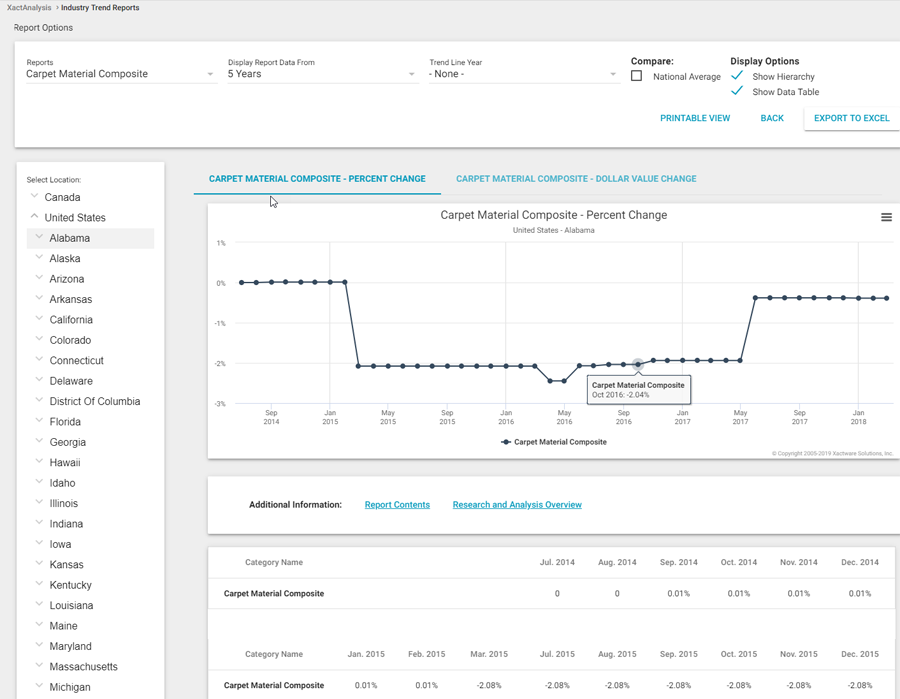
Carpet Material Composite Report
This report displays the monthly changes in value of common carpeting materials over a specified number of years. All data in this report is based on building cost data published by Xactware.
For a list of line items that were tracked for this report, click here.
Several features are available with this report:
Percent Change
Click this tab, located above the graph, to view the provided data according to the monthly percent of change from the first month listed.
Dollar Value Change
Click this tab, located above the graph, to view the provided data according to the dollar amount change each month.
Display Report Data From
Use this menu to change the span of time displayed in the report. You can choose from the past one to five years.
Project Trend Line From
Select a year from this menu to add a line on the graph that represents that year’s industry trend. After selecting a year, a second menu appears that allows you to select a month or quarter of that year from which to start the trend line.
Compare
If you drill down in the hierarchy tree to a location below the national level, one or both of the Compare check boxes become available. When selected, additional plot lines are added to the graph that represent the national or state average.
Show Hierarchy
Clear this check box to hide the location hierarchy to the left of the graph.
Show Data Table
Clear this check box to hide the data table below the graph.
Export to Excel
Click Export to Excel to export the data from the report into an Excel spreadsheet.
Back
Click Back to return to previously viewed reports.
Printable View
Click Printable View to open a new window with a printer-friendly version of the graph and data.
Report Contents
Click this link to open a new window that displays all of the Xactimate price list items that were tracked for this report.
Research and Analysis Overview
Click this link to open a new window that explains how Xactware researches and updates the prices for its price lists.
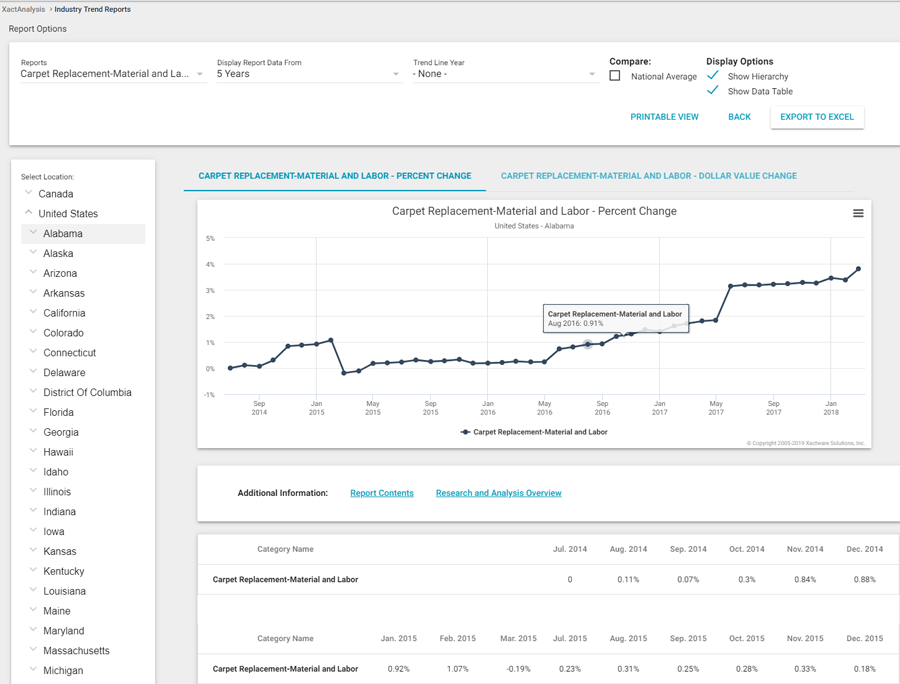
Carpet Replacement—Material and Labor Report
This report displays the monthly changes in value for a group of materials and labor associated with replacing carpet in an average room. These changes are shown over a specified number of years. All data in this report is based on building cost data published by Xactware.
For a list of line items that were tracked for this report, click here.
Several features are available with this report:
Percent Change
Click this tab, located above the graph, to view the provided data according to the monthly percent of change from the first month listed.
Dollar Value Change
Click this tab, located above the graph, to view the provided data according to the dollar amount change each month.
Display Report Data From
This menu allows you to change the span of time displayed in the report. You can choose from the past one to five years.
Project Trend Line From
Select a year from this menu to add a line on the graph that represents that year’s industry trend. After selecting a year, a second menu appears that allows you to select a month or quarter of that year from which to start the trend line.
Compare
If you drill down in the hierarchy tree to a location below the national level, one or both of the Compare check boxes become available. When selected, additional plot lines are added to the graph that represent the national or state average.
Show Hierarchy
Clear this check box to hide the location hierarchy to the left of the graph.
Show Data Table
Clear this check box to hide the data table below the graph.
Export to Excel
Click Export to Excel to export the data from the report into an Excel spreadsheet.
Back
Click Back to return to previously viewed reports.
Printable View
Click Printable View to open a new window with a printer-friendly version of the graph and data.
Report Contents
Click this link to open a new window that displays all of the Xactimate price list items that were tracked for this report.
Research and Analysis Overview
Click this link to open a new window that explains how Xactware researches and updates the prices for its price lists.
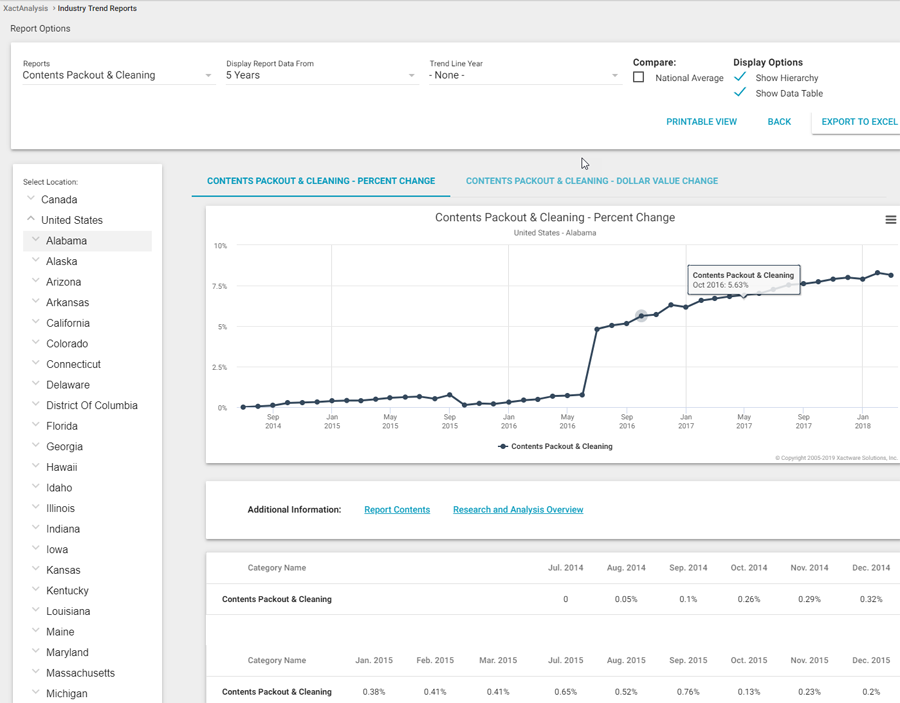
Contents Packout & Cleaning Report
This report displays the monthly changes in value of common labor associated with moving room contents and cleaning. These changes are shown over a specified number of years. All data in this report is based on building cost data published by Xactware.
For a list of line items that were tracked for this report, click here.
Several features are available with this report:
Percent Change
Click this tab, located above the graph, to view the provided data according to the monthly percent of change from the first month listed.
Dollar Value Change
Click this tab, located above the graph, to view the provided data according to the dollar amount change each month.
Display Report Data From
This menu allows you to change the span of time displayed in the report. You can choose from the past one to five years.
Project Trend Line From
Select a year from this menu to add a line on the graph that represents that year’s industry trend. After selecting a year, a second menu appears that allows you to select a month or quarter of that year from which to start the trend line.
Compare
If you drill down in the hierarchy tree to a location below the national level, one or both of the Compare check boxes become available. When selected, additional plot lines are added to the graph that represent the national or state average.
Show Hierarchy
Clear this check box to hide the location hierarchy on the left of the graph.
Show Data Table
Clear this check box to hide the data table below the graph.
Export to Excel
Click Export to Excel to export the data from the report into an Excel spreadsheet.
Back
Click Back to return to previously viewed reports.
Printable View
Click Printable View to open a new window with a printer-friendly version of the graph and data.
Report Contents
Click this link to open a new window that displays all of the Xactimate price list items that were tracked for this report.
Research and Analysis Overview
Click this link to open a new window that explains how Xactware researches and updates the prices for its price lists.
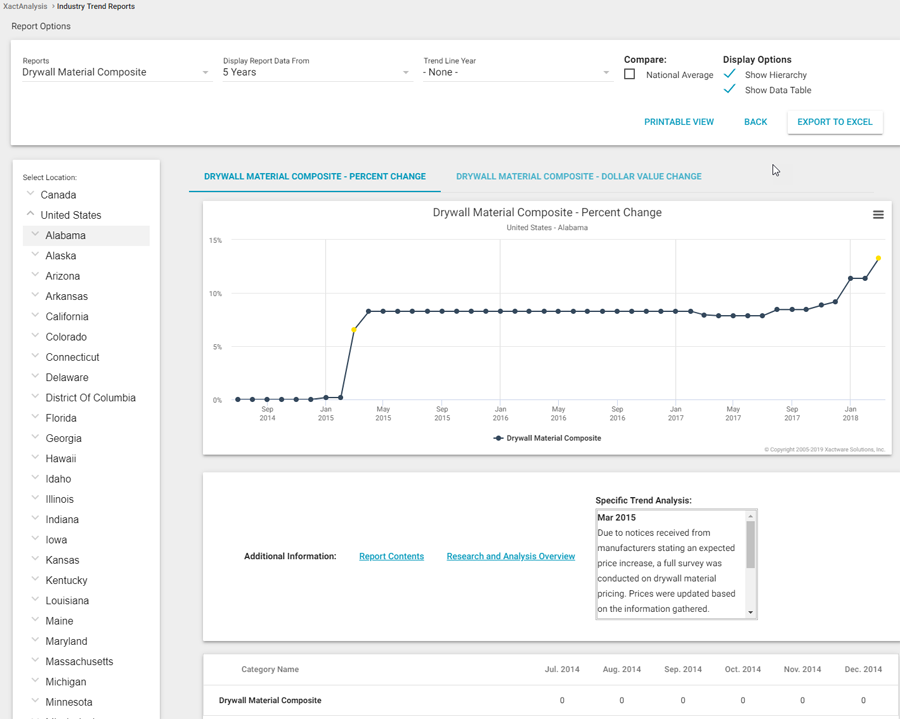
Drywall Material Composite Report
This report displays the monthly changes in value of a group of common drywall materials over a specified number of years. All data in this report is based on building cost data published by Xactware.
For a list of line items that were tracked for this report, click here.
Several features are available with this report:
Percent Change
Click this tab, located above the graph, to view the provided data according to the monthly percent of change from the first month listed.
Dollar Value Change
Click this tab, located above the graph, to view the provided data according to the dollar amount change each month.
Display Report Data From
This menu allows you to change the span of time displayed in the report. You can choose from the past one to five years.
Project Trend Line From
Select a year from this menu to add a line on the graph that represents that year’s industry trend. After selecting a year, a second menu appears that allows you to select a month or quarter of that year from which to start the trend line.
Compare
If you drill down in the hierarchy tree to a location below the national level, one or both of the Compare check boxes become available. When selected, additional plot lines are added to the graph that represent the national or state average.
Show Hierarchy
Clear this check box to hide the location hierarchy to the left of the graph.
Show Data Table
Clear this check box to hide the data table below the graph.
Export to Excel
Click Export to Excel to export the data from the report into an Excel spreadsheet.
Back
Click Back to return to previously viewed reports.
Printable View
Click Printable View to open a new window with a printer-friendly version of the graph and data.
Report Contents
Click this link to open a new window that displays all of the Xactimate price list items that were tracked for this report.
Research and Analysis Overview
Click this link to open a new window that explains how Xactware researches and updates the prices for its price lists.
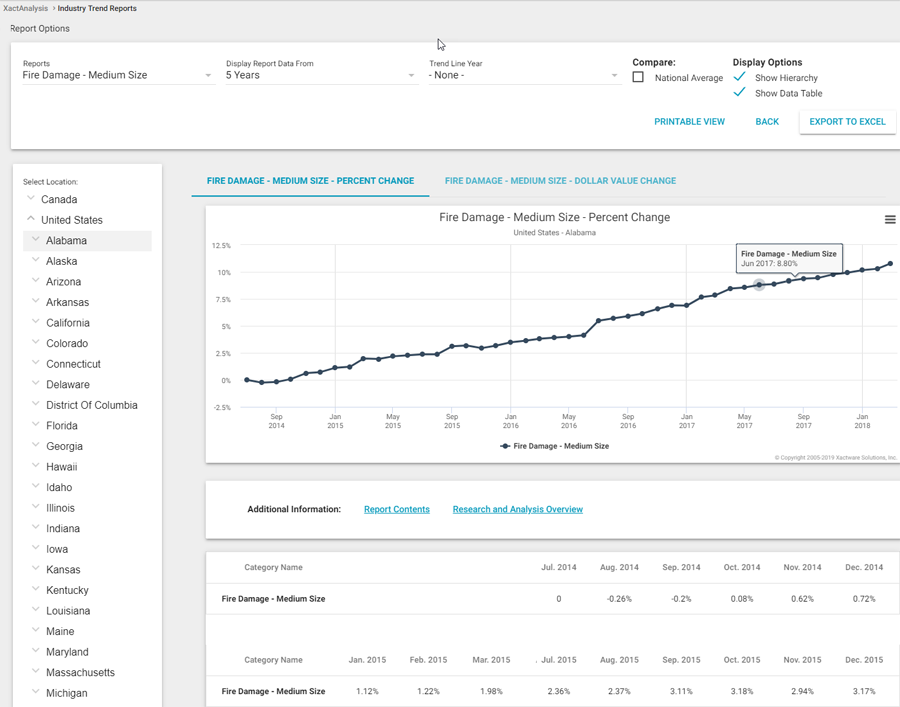
Fire Damage—Medium Size Report
This report displays the monthly changes in value of a group of common materials and labor associated with a medium-size fire loss. These changes are shown over a specified number of years. All data in this report is based on building cost data published by Xactware.
For a list of line items that were tracked for this report, click here.
Several features are available with this report:
Percent Change
Click this tab, located above the graph, to view the provided data according to the monthly percent of change from the first month listed.
Dollar Value Change
Click this tab, located above the graph, to view the provided data according to the dollar amount change each month.
Display Report Data From
This menu allows you to change the span of time displayed in the report. You can choose from the past one to five years.
Project Trend Line From
Select a year from this menu to add a line on the graph that represents that year’s industry trend. After selecting a year, a second menu appears that allows you to select a month or quarter of that year from which to start the trend line.
Compare
If you drill down in the hierarchy tree to a location below the national level, one or both of the Compare check boxes become available. When selected, additional plot lines are added to the graph that represent the national or state average.
Show Hierarchy
Clear this check box to hide the location hierarchy to the left of the graph.
Show Data Table
Clear this check box to hide the data table below the graph.
Export to Excel
Click Export to Excel to export the data from the report into an Excel spreadsheet.
Back
Click Back to return to previously viewed reports.
Printable View
Click Printable View to open a new window with a printer-friendly version of the graph and data.
Report Contents
Click this link to open a new window that displays all of the Xactimate price list items that were tracked for this report.
Research and Analysis Overview
Click this link to open a new window that explains how Xactware researches and updates the prices for its price lists.
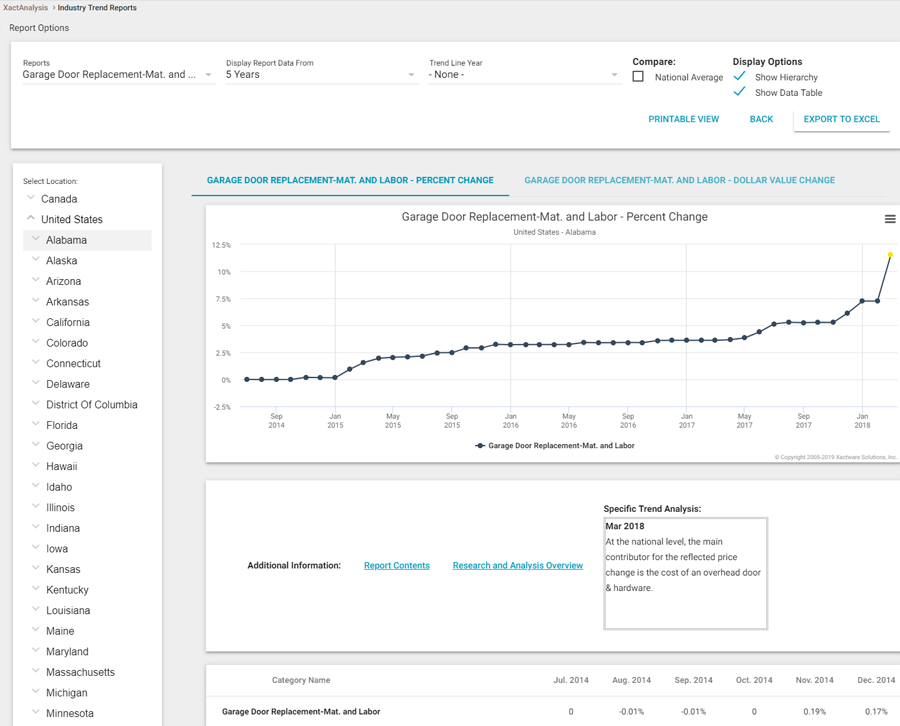
Garage Door Replacement—Mat. and Labor Report
This report displays the monthly changes in value for a group of materials and labor associated with an average garage door replacement. These changes are shown over a specified number of years. All data in this report is based on building cost data published by Xactware.
For a list of line items that were tracked for this report, click here.
Several features are available with this report:
Percent Change
Click this tab, located above the graph, to view the provided data according to the monthly percent of change from the first month listed.
Dollar Value Change
Click this tab, located above the graph, to view the provided data according to the dollar amount change each month.
Display Report Data From
This menu allows you to change the span of time displayed in the report. You can choose from the past one to five years.
Project Trend Line From
Select a year from this menu to add a line on the graph that represents that year’s industry trend. After selecting a year, a second menu appears that allows you to select a month or quarter of that year from which to start the trend line.
Compare
If you drill down in the hierarchy tree to a location below the national level, one or both of the Compare check boxes become available. When selected, additional plot lines are added to the graph that represent the national or state average.
Show Hierarchy
Clear this check box to hide the location hierarchy on the left of the graph.
Show Data Table
Clear this check box to hide the data table below the graph.
Export to Excel
Click Export to Excel to export the data from the report into an Excel spreadsheet.
Back
Click Back to return to previously viewed reports.
Printable View
Click Printable View to open a new window with a printer-friendly version of the graph and data.
Report Contents
Click this link to open a new window that displays all of the Xactimate price list items that were tracked for this report.
Research and Analysis Overview
Click this link to open a new window that explains how Xactware researches and updates the prices for its price lists.
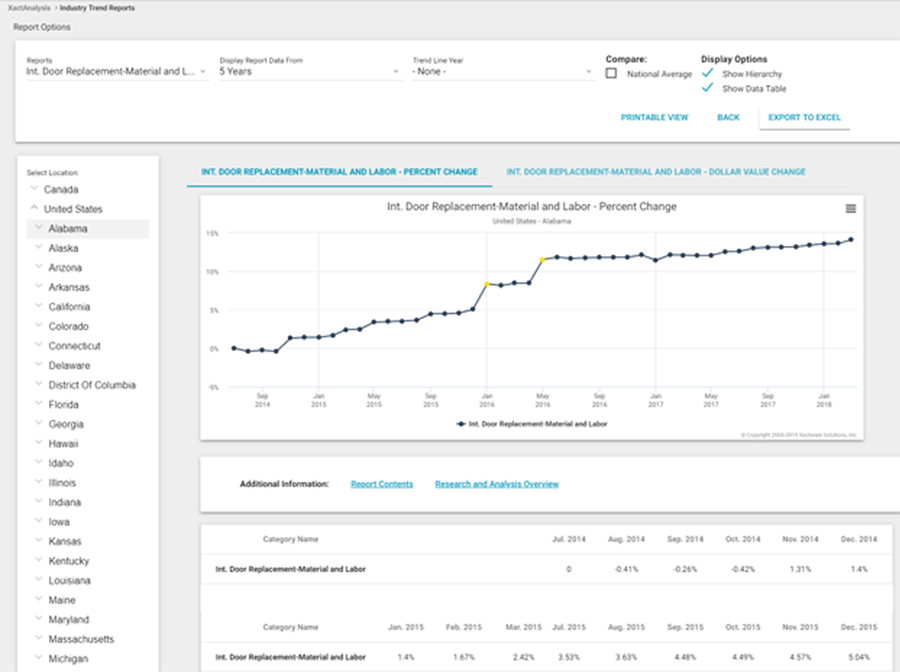
Int. Door Replacement—Material and Labor Report
This report displays the monthly changes in value for a group of materials and labor associated with an average interior door replacement. These changes are shown over a specified number of years. All data in this report is based on building cost data published by Xactware.
For a list of line items that were tracked for this report, click here.
Several features are available with this report:
Percent Change
Click this tab, located above the graph, to view the provided data according to the monthly percent of change from the first month listed.
Dollar Value Change
Click this tab, located above the graph, to view the provided data according to the dollar amount change each month.
Display Report Data From
This menu allows you to change the span of time displayed in the report. You can choose from the past one to five years.
Project Trend Line From
Select a year from this menu to add a line on the graph that represents that year’s industry trend. After selecting a year, a second menu appears that allows you to select a month or quarter of that year from which to start the trend line.
Compare
If you drill down in the hierarchy tree to a location below the national level, one or both of the Compare check boxes become available. When selected, additional plot lines are added to the graph that represent the national or state average.
Show Hierarchy
Clear this check box to hide the location hierarchy on the left of the graph.
Show Data Table
Clear this check box to hide the data table below the graph.
Export to Excel
Click Export to Excel to export the data from the report into an Excel spreadsheet.
Back
Click Back to return to previously viewed reports.
Printable View
Click Printable View to open a new window with a printer-friendly version of the graph and data.
Report Contents
Click this link to open a new window that displays all of the Xactimate price list items that were tracked for this report.
Research and Analysis Overview
Click this link to open a new window that explains how Xactware researches and updates the prices for its price lists.
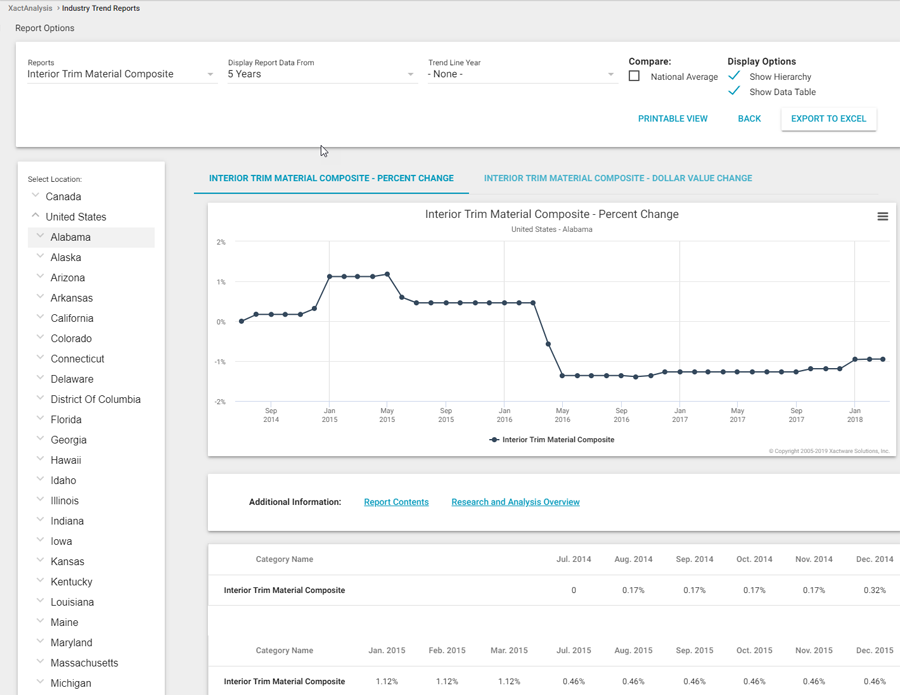
Interior Trim Material Composite Report
This report displays the monthly changes in value for a group of common trim / molding materials over a specified number of years. All data in this report is based on building cost data published by Xactware.
For a list of line items that were tracked for this report, click here.
Several features are available with this report:
Percent Change
Click this tab, located above the graph, to view the provided data according to the monthly percent of change from the first month listed.
Dollar Value Change
Click this tab, located above the graph, to view the provided data according to the dollar amount change each month.
Display Report Data From
This menu allows you to change the span of time displayed in the report. You can choose from the past one to five years.
Project Trend Line From
Select a year from this menu to add a line on the graph that represents that year’s industry trend. After selecting a year, a second menu appears that allows you to select a month or quarter of that year from which to start the trend line.
Compare
If you drill down in the hierarchy tree to a location below the national level, one or both of the Compare check boxes become available. When selected, additional plot lines are added to the graph that represent the national or state average.
Show Hierarchy
Clear this check box to hide the location hierarchy on the left of the graph.
Show Data Table
Clear this check box to hide the data table below the graph.
Export to Excel
Click Export to Excel to export the data from the report into an Excel spreadsheet.
Back
Click Back to return to previously viewed reports.
Printable View
Click Printable View to open a new window with a printer-friendly version of the graph and data.
Report Contents
Click this link to open a new window that displays all of the Xactimate price list items that were tracked for this report.
Research and Analysis Overview
Click this link to open a new window that explains how Xactware researches and updates the prices for its price lists.
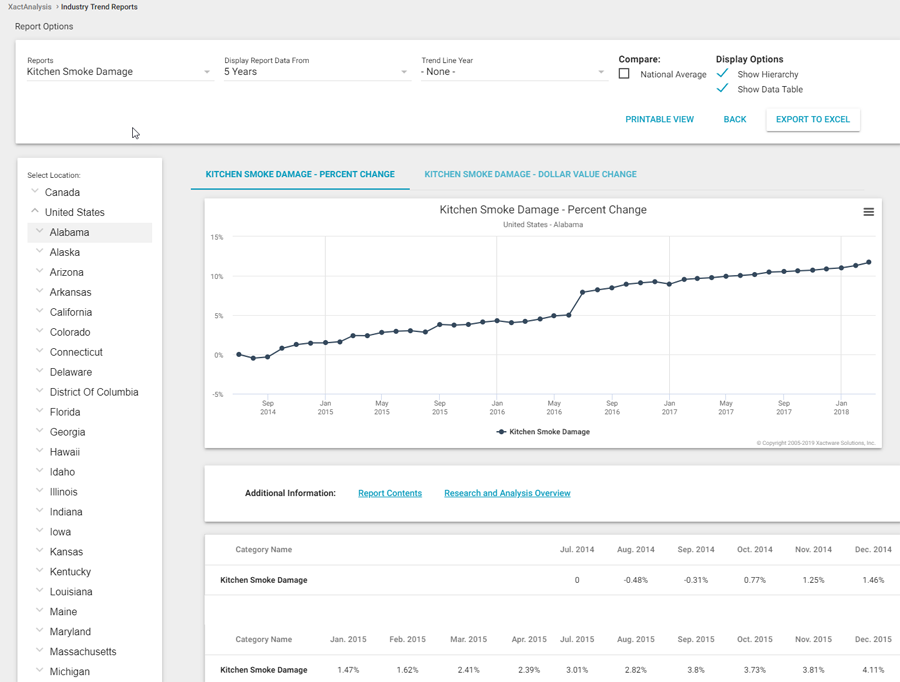
Kitchen Smoke Damage Report
This report displays the monthly changes in value for a group of common materials associated with kitchen smoke damage. These changes are shown over a specified number of years. All data in this report is based on building cost data published by Xactware.
For a list of line items that were tracked for this report, click here.
Several features are available with this report:
Percent Change
Click this tab, located above the graph, to view the provided data according to the monthly percent of change from the first month listed.
Dollar Value Change
Click this tab, located above the graph, to view the provided data according to the dollar amount change each month.
Display Report Data From
This menu allows you to change the span of time displayed in the report. You can choose from the past one to five years.
Project Trend Line From
Select a year from this menu to add a line on the graph that represents that year’s industry trend. After selecting a year, a second menu appears that allows you to select a month or quarter of that year from which to start the trend line.
Compare
If you drill down in the hierarchy tree to a location below the national level, one or both of the Compare check boxes become available. When selected, additional plot lines are added to the graph that represent the national or state average.
Show Hierarchy
Clear this check box to hide the location hierarchy on the left of the graph.
Show Data Table
Clear this check box to hide the data table below the graph.
Export to Excel
Click Export to Excel to export the data from the report into an Excel spreadsheet.
Back
Click Back to return to previously viewed reports.
Printable View
Click Printable View to open a new window with a printer-friendly version of the graph and data.
Report Contents
Click this link to open a new window that displays all of the Xactimate price list items that were tracked for this report.
Research and Analysis Overview
Click this link to open a new window that explains how Xactware researches and updates the prices for its price lists.
Laminated Shingle—Labor & Materials Report
This report displays the monthly changes in value for a group of common materials and labor associated with a laminated shingle roof replacement. These changes are shown over a specified number of years. All data in this report is based on building cost data published by Xactware.
For a list of line items that were tracked for this report, click Report Contents below the report.
Several features are available with this report:
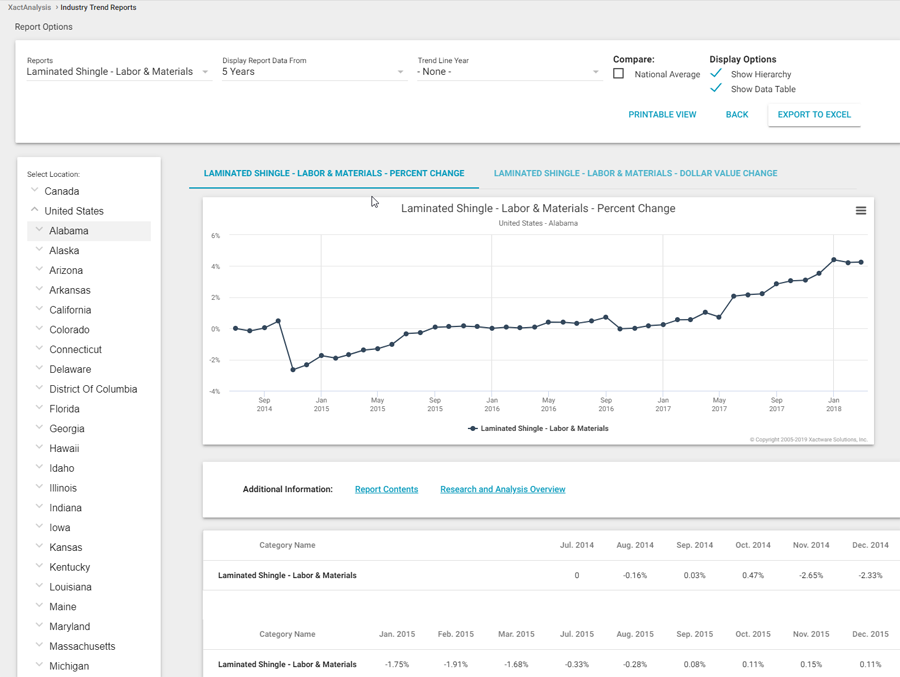
Percent Change
Click this tab, located above the graph, to view the provided data according to the monthly percent of change from the first month listed.
Dollar Value Change
Click this tab, located above the graph, to view the provided data according to the dollar amount change each month.
Display Report Data From
This menu allows you to change the span of time displayed in the report. You can choose from the past one to five years.
Project Trend Line From
Select a year from this menu to add a line on the graph that represents that year’s industry trend. After selecting a year, a second menu appears that allows you to select a month or quarter of that year from which to start the trend line.
Compare
If you drill down in the hierarchy tree to a location below the national level, one or both of the Compare check boxes become available. When selected, additional plot lines are added to the graph that represent the national or state average.
Show Hierarchy
Clear this check box to hide the location hierarchy on the left of the graph.
Show Data Table
Clear this check box to hide the data table below the graph.
Export to Excel
Click Export to Excel to export the data from the report into an Excel spreadsheet.
Back
Click Back to return to previously viewed reports.
Printable View
Click Printable View to open a new window with a printer-friendly version of the graph and data.
Report Contents
Click this link to open a new window that displays all of the Xactimate price list items that were tracked for this report.
Research and Analysis Overview
Click this link to open a new window that explains how Xactware researches and updates the prices for its price lists.
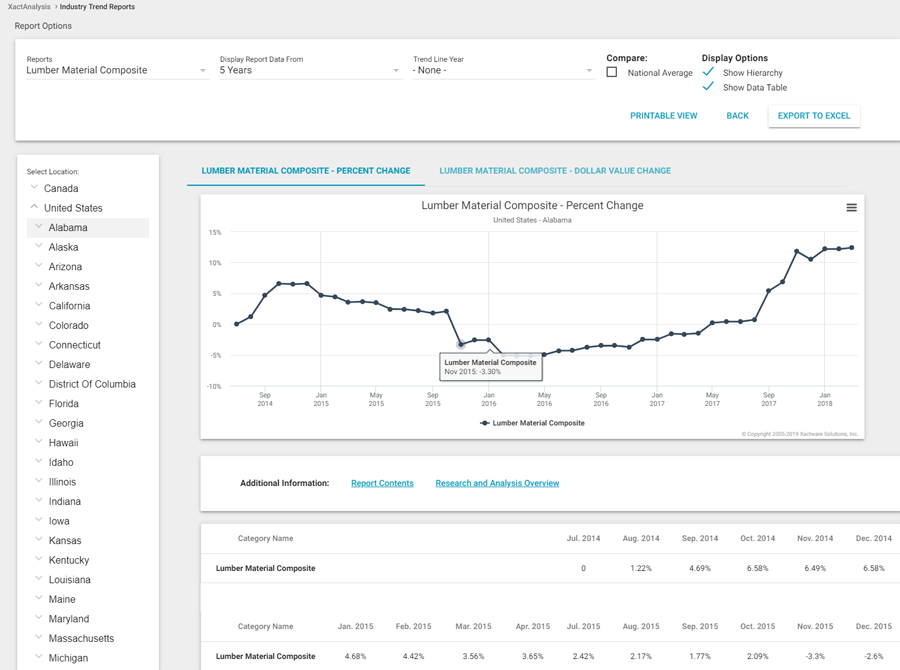
Lumber Material Composite Report
This report displays the monthly changes in value for a group of common types of lumber over a specified number of years. All data in this report is based on building cost data published by Xactware.
For a list of line items that were tracked for this report, click here.
Several features are available with this report:
Percent Change
Click this tab, located above the graph, to view the provided data according to the monthly percent of change from the first month listed.
Dollar Value Change
Click this tab, located above the graph, to view the provided data according to the dollar amount change each month.
Display Report Data From
This menu allows you to change the span of time displayed in the report. You can choose from the past one to five years.
Project Trend Line From
Select a year from this menu to add a line on the graph that represents that year’s industry trend. After selecting a year, a second menu appears that allows you to select a month or quarter of that year from which to start the trend line.
Compare
If you drill down in the hierarchy tree to a location below the national level, one or both of the Compare check boxes become available. When selected, additional plot lines are added to the graph that represent the national or state average.
Show Hierarchy
Clear this check box to hide the location hierarchy on the left of the graph.
Show Data Table
Clear this check box to hide the data table below the graph.
Export to Excel
Click Export to Excel to export the data from the report into an Excel spreadsheet.
Back
Click Back to return to previously viewed reports.
Printable View
Click Printable View to open a new window with a printer-friendly version of the graph and data.
Report Contents
Click this link to open a new window that displays all of the Xactimate price list items that were tracked for this report.
Research and Analysis Overview
Click this link to open a new window that explains how Xactware researches and updates the prices for its price lists.
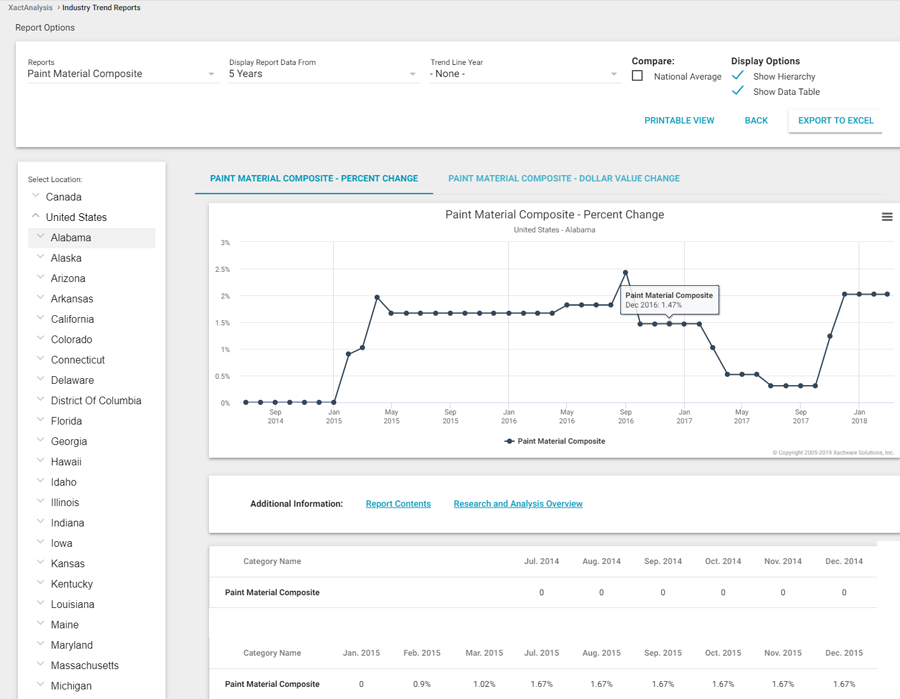
Paint Material Composite Report
This report displays the monthly changes in value for a group of common materials associated with painting. These changes are shown over a specified number of years. All data in this report is based on building cost data published by Xactware.
For a list of line items that were tracked for this report, click here.
Several features are available with this report:
Percent Change
Click this tab, located above the graph, to view the provided data according to the monthly percent of change from the first month listed.
Dollar Value Change
Click this tab, located above the graph, to view the provided data according to the dollar amount change each month.
Display Report Data From
This menu allows you to change the span of time displayed in the report. You can choose from the past one to five years.
Project Trend Line From
Select a year from this menu to add a line on the graph that represents that year’s industry trend. After selecting a year, a second menu appears that allows you to select a month or quarter of that year from which to start the trend line.
Compare
If you drill down in the hierarchy tree to a location below the national level, one or both of the Compare check boxes become available. When selected, additional plot lines are added to the graph that represent the national or state average.
Show Hierarchy
Clear this check box to hide the location hierarchy on the left of the graph.
Show Data Table
Clear this check box to hide the data table below the graph.
Export to Excel
Click Export to Excel to export the data from the report into an Excel spreadsheet.
Back
Click Back to return to previously viewed reports.
Printable View
Click Printable View to open a new window with a printer-friendly version of the graph and data.
Report Contents
Click this link to open a new window that displays all of the Xactimate price list items that were tracked for this report.
Research and Analysis Overview
Click this link to open a new window that explains how Xactware researches and updates the prices for its price lists.
Price List Changes Report
This report lists all of the price list changes over a selected number of years.
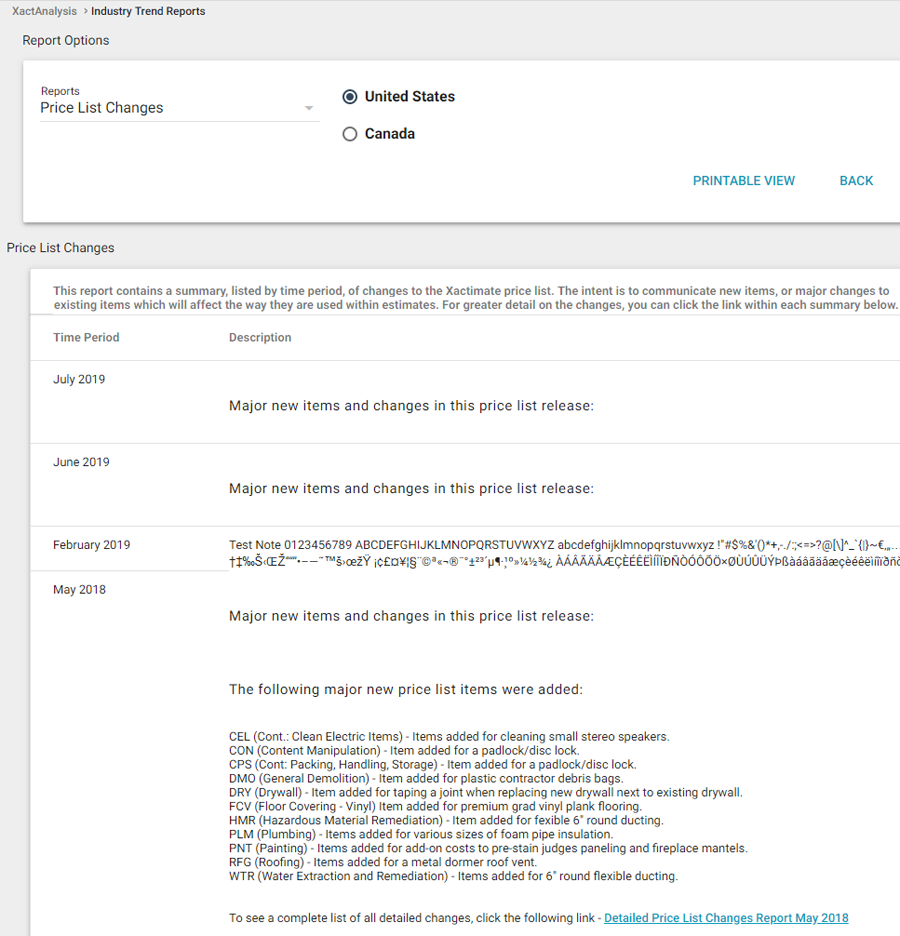
The following features are available with this report:
Display Report Data From
This menu allows you to change the span of time displayed in the report. You can choose from the past one to five years.
Back
Click Back to return to previously viewed reports.
Printable View
Click Printable View to open a new window with a printer-friendly version of the graph and data.
Retail Labor Report
This report displays the average percent of change in labor costs for the most common trades over a specified number of years. All data in this report is based on researched information published by Xactware.
For a list of line items that were tracked for this report, click here.
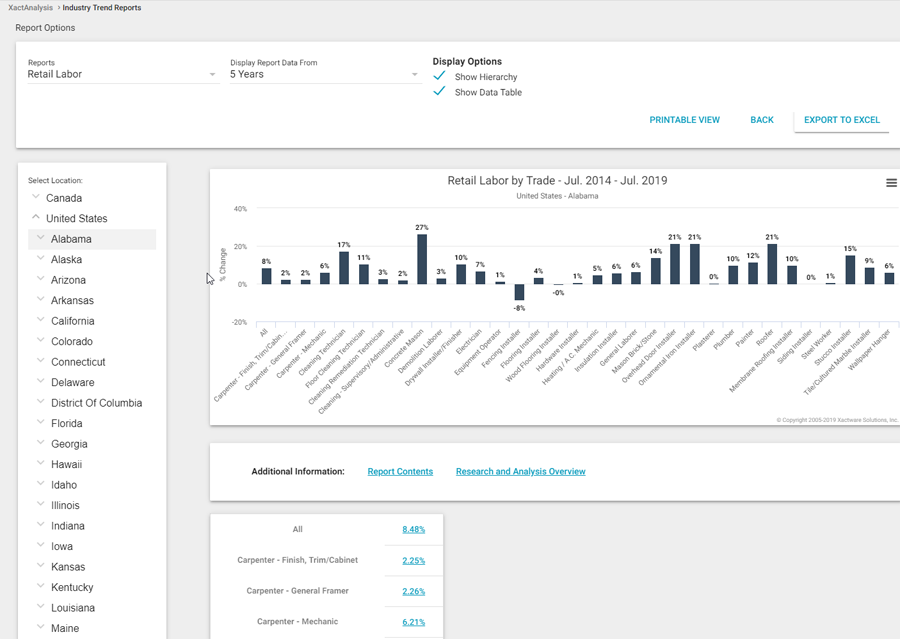
Several features are available with this report:
Display Report Data From
This menu allows you to change the span of time displayed in the report. You can choose from the past one to five years.
Show Hierarchy
Clear this check box to hide the location hierarchy to the left of the graph.
Show Data Table
Clear this check box to hide the data table below the graph.
Export to Excel
Click Export to Excel to export the data from the report into an Excel spreadsheet.
Back
Click Back to return to previously viewed reports.
Printable View
Click Printable View to open a new window with a printer-friendly version of the graph and data.
Report Contents
Click this link to open a new window that displays all of the Xactimate price list items that were tracked for this report.
Research and Analysis Overview
Click this link to open a new window that explains how Xactware researches and updates the prices for its price lists.
Individual Trade Reports
Click on any of the bars in the graph to see a report specific to that trade.
Individual trade reports available from the Retail Labor report
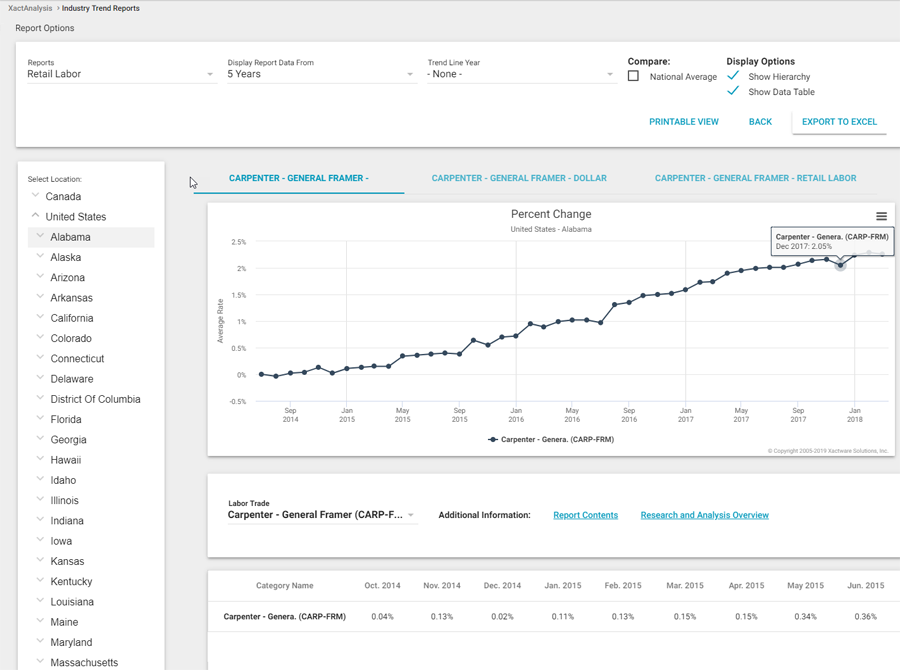
Each trade report has all of the same features as the Retail Labor report as well as:
Project Trend Line From
Select a year from this menu to add a line on the graph that represents that year’s industry trend. After selecting a year, a second menu appears that allows you to select a month or quarter of that year from which to start the trend line.
Labor Trade
This menu allows you to change the report to any of the other individual trade reports.
Percent Change
Click this tab, located above the graph, to view the provided data according to the monthly percent of change from the first month listed.
Dollar Value Change
Click this tab, located above the graph, to view the provided data according to the dollar amount change each month.
Retail Labor Breakdown
Click this tab, located above the graph, to view a breakdown of the provided data according to wage, burden, and overhead by month.
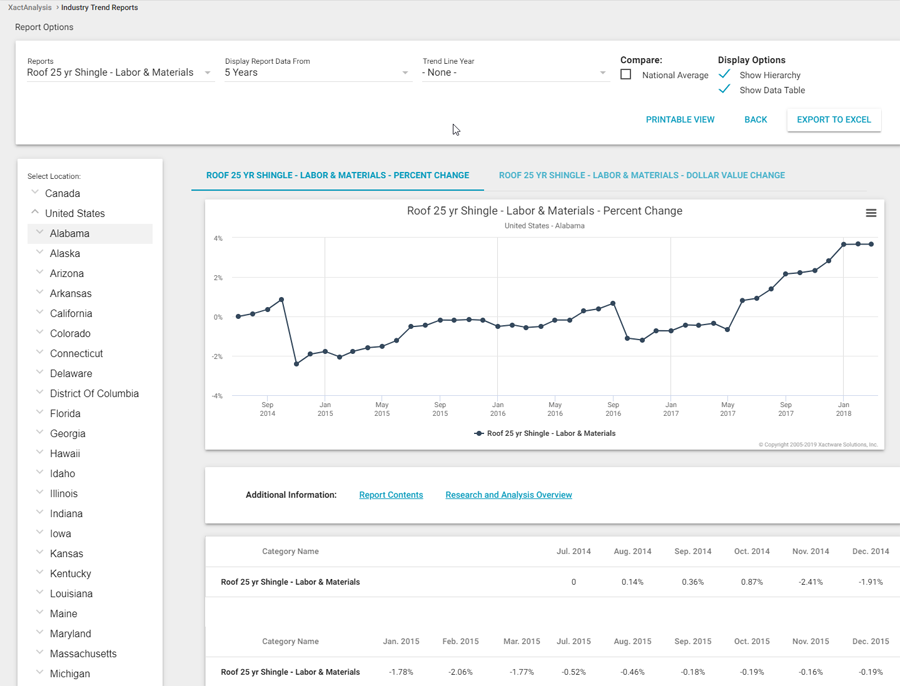
Roof 25 yr Shingle—Labor & Materials Report
This report displays the monthly changes in value for a group of common materials and labor associated with a 25-year, 3-tab shingle roof replacement. These changes are shown over a specified number of years. All data in this report is based on building cost data published by Xactware.
For a list of line items that were tracked for this report, click here.
Several features are available with this report:
Percent Change
Click this tab, located above the graph, to view the provided data according to the monthly percent of change from the first month listed.
Dollar Value Change
Click this tab, located above the graph, to view the provided data according to the dollar amount change each month.
Display Report Data From
This menu allows you to change the span of time displayed in the report. You can choose from the past one to five years.
Project Trend Line From
Select a year from this menu to add a line on the graph that represents that year’s industry trend. After selecting a year, a second menu appears that allows you to select a month or quarter of that year from which to start the trend line.
Compare
If you drill down in the hierarchy tree to a location below the national level, one or both of the Compare check boxes become available. When selected, additional plot lines are added to the graph that represent the national or state average.
Show Hierarchy
Clear this check box to hide the location hierarchy on the left of the graph.
Show Data Table
Clear this check box to hide the data table below the graph.
Export to Excel
Click Export to Excel to export the data from the report into an Excel spreadsheet.
Back
Click Back to return to previously viewed reports.
Printable View
Click Printable View to open a new window with a printer-friendly version of the graph and data.
Report Contents
Click this link to open a new window that displays all of the Xactimate price list items that were tracked for this report.
Research and Analysis Overview
Click this link to open a new window that explains how Xactware researches and updates the prices for its price lists.
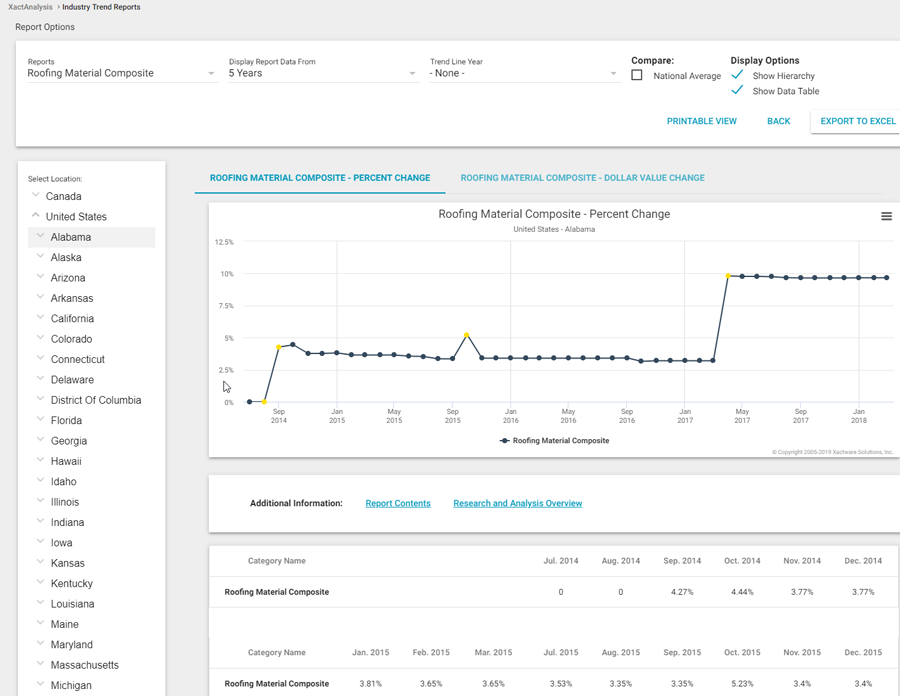
Roofing Material Composite Report
This report displays the monthly changes in value for a group of common roofing materials over a specified number of years. All data in this report is based on building cost data published by Xactware.
For a list of line items that were tracked for this report, click here.
Several features are available with this report:
Percent Change
Click this tab, located above the graph, to view the provided data according to the monthly percent of change from the first month listed.
Dollar Value Change
Click this tab, located above the graph, to view the provided data according to the dollar amount change each month.
Display Report Data From
This menu allows you to change the span of time displayed in the report. You can choose from the past one to five years.
Project Trend Line From
Select a year from this menu to add a line on the graph that represents that year’s industry trend. After selecting a year, a second menu appears that allows you to select a month or quarter of that year from which to start the trend line.
Compare
If you drill down in the hierarchy tree to a location below the national level, one or both of the Compare check boxes become available. When selected, additional plot lines are added to the graph that represent the national or state average.
Show Hierarchy
Clear this check box to hide the location hierarchy on the left of the graph.
Show Data Table
Clear this check box to hide the data table below the graph.
Export to Excel
Click Export to Excel to export the data from the report into an Excel spreadsheet.
Back
Click Back to return to previously viewed reports.
Printable View
Click Printable View to open a new window with a printer-friendly version of the graph and data.
Report Contents
Click this link to open a new window that displays all of the Xactimate price list items that were tracked for this report.
Research and Analysis Overview
Click this link to open a new window that explains how Xactware researches and updates the prices for its price lists.
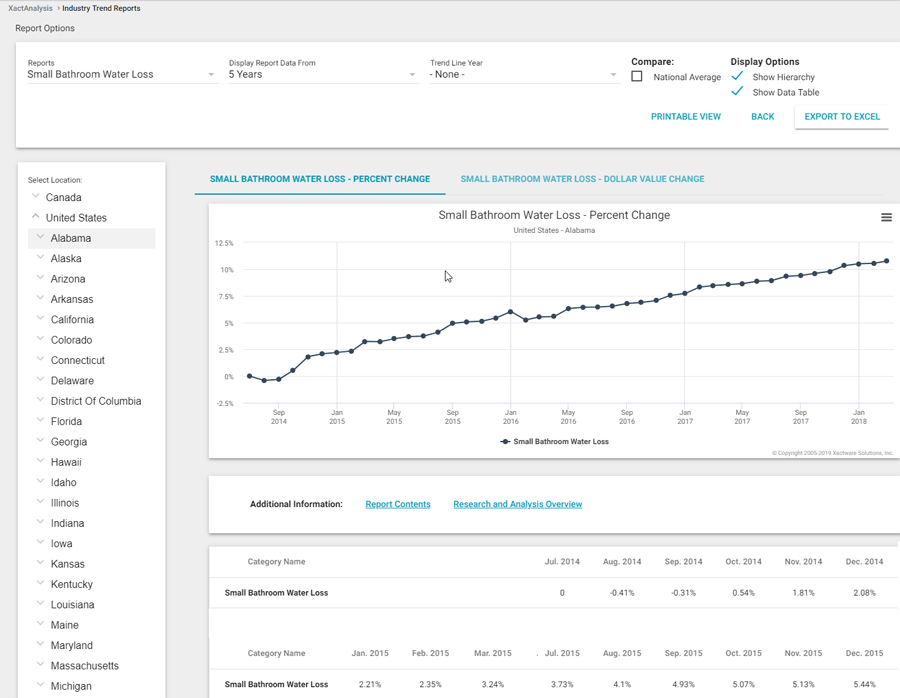
Small Bathroom Water Loss Report
This report displays the monthly changes in value for a group of common materials and labor associated with water loss in a small bathroom. These changes are shown over a specified number of years. All data in this report is based on building cost data published by Xactware.
For a list of line items that were tracked for this report, click here.
Several features are available with this report:
Percent Change
Click this tab, located above the graph, to view the provided data according to the monthly percent of change from the first month listed.
Dollar Value Change
Click this tab, located above the graph, to view the provided data according to the dollar amount change each month.
Display Report Data From
This menu allows you to change the span of time displayed in the report. You can choose from the past one to five years.
Trend Line Year
Select a year from this menu to add a line on the graph that represents that year’s industry trend. After selecting a year, a second menu appears that allows you to select a month or quarter of that year from which to start the trend line.
Compare
If you drill down in the hierarchy tree to a location below the national level, one or both of the Compare check boxes become available. When selected, additional plot lines are added to the graph that represent the national or state average.
Show Hierarchy
Clear this check box to hide the location hierarchy on the left of the graph.
Show Data Table
Clear this check box to hide the data table below the graph.
Export to Excel
Click Export to Excel to export the data from the report into an Excel spreadsheet.
Back
Click Back to return to previously viewed reports.
Printable View
Click Printable View to open a new window with a printer-friendly version of the graph and data.
Report Contents
Click this link to open a new window that displays all of the Xactimate price list items that were tracked for this report.
Research and Analysis Overview
Click this link to open a new window that explains how Xactware researches and updates the prices for its price lists.
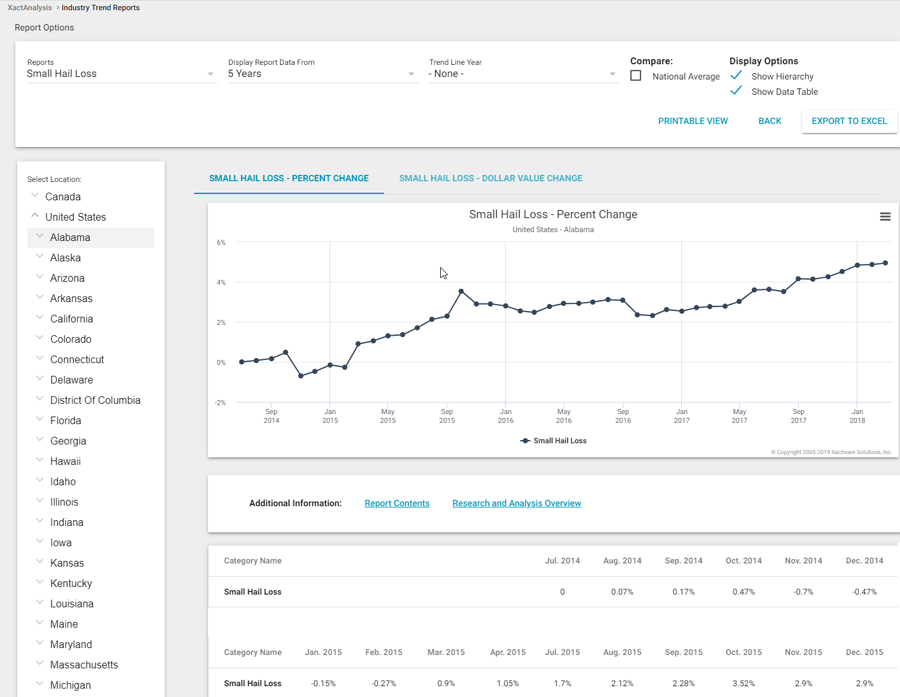
Small Hail Loss Report
This report displays the monthly changes in value for a group of common materials and labor associated with a small hail loss. These changes are shown over a specified number of years. All data in this report is based on building cost data published by Xactware.
For a list of line items that were tracked for this report, click here.
Several features are available with this report:
Percent Change
Click this tab, located above the graph, to view the provided data according to the monthly percent of change from the first month listed.
Dollar Value Change
Click this tab, located above the graph, to view the provided data according to the dollar amount change each month.
Display Report Data From
This menu allows you to change the span of time displayed in the report. You can choose from the past one to five years.
Project Trend Line From
Select a year from this menu to add a line on the graph that represents that year’s industry trend. After selecting a year, a second menu appears that allows you to select a month or quarter of that year from which to start the trend line.
Compare
If you drill down in the hierarchy tree to a location below the national level, one or both of the Compare check boxes become available. When selected, additional plot lines are added to the graph that represent the national or state average.
Show Hierarchy
Clear this check box to hide the location hierarchy on the left of the graph.
Show Data Table
Clear this check box to hide the data table below the graph.
Export to Excel
Click Export to Excel to export the data from the report into an Excel spreadsheet.
Back
Click Back to return to previously viewed reports.
Printable View
Click Printable View to open a new window with a printer-friendly version of the graph and data.
Report Contents
Click this link to open a new window that displays all of the Xactimate price list items that were tracked for this report.
Research and Analysis Overview
Click this link to open a new window that explains how Xactware researches and updates the prices for its price lists.
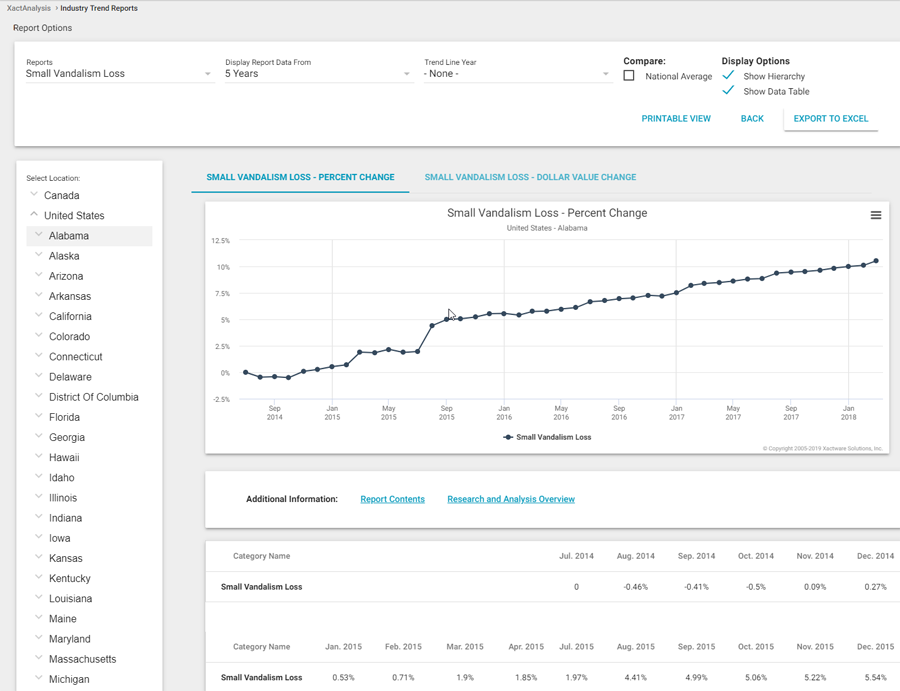
Small Vandalism Loss Report
This report displays the monthly changes in value for a group of common materials and labor associated with a small vandalism loss. These changes are shown over a specified number of years. All data in this report is based on building cost data published by Xactware.
For a list of line items that were tracked for this report, click here.
Several features are available with this report:
Percent Change
Click this tab, located above the graph, to view the provided data according to the monthly percent of change from the first month listed.
Dollar Value Change
Click this tab, located above the graph, to view the provided data according to the dollar amount change each month.
Display Report Data From
This menu allows you to change the span of time displayed in the report. You can choose from the past one to five years.
Project Trend Line From
Select a year from this menu to add a line on the graph that represents that year’s industry trend. After selecting a year, a second menu appears that allows you to select a month or quarter of that year from which to start the trend line.
Compare
If you drill down in the hierarchy tree to a location below the national level, one or both of the Compare check boxes become available. When selected, additional plot lines are added to the graph that represent the national or state average.
Show Hierarchy
Clear this check box to hide the location hierarchy on the left of the graph.
Show Data Table
Clear this check box to hide the data table below the graph.
Export to Excel
Click Export to Excel to export the data from the report into an Excel spreadsheet.
Back
Click Back to return to previously viewed reports.
Printable View
Click Printable View to open a new window with a printer-friendly version of the graph and data.
Report Contents
Click this link to open a new window that displays all of the Xactimate price list items that were tracked for this report.
Research and Analysis Overview
Click this link to open a new window that explains how Xactware researches and updates the prices for its price lists.
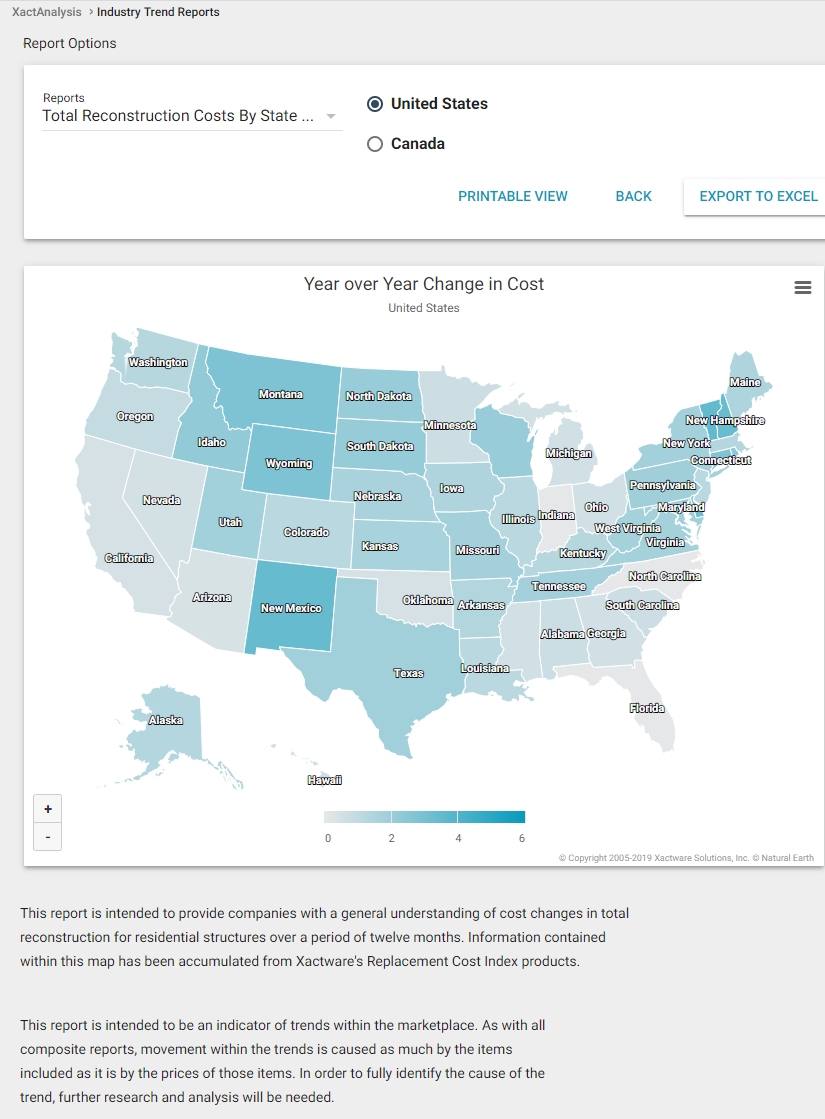
Total Reconstruction Costs By State Report
This report displays the percent of change in each state for residential structure reconstruction costs. The color of each state corresponds with the percentage range that the state has increased or decreased over the past year.
Several features are available with this report:
Country Select
You can choose which country you would like displayed in the report by clicking on the country’s corresponding radio button.
Export to Excel
Click Export to Excel to export the data from the report into an Excel spreadsheet.
Back
Click Back to return to previously viewed reports.
Printable View
Click Printable View to open a new window with a printer-friendly version of the graph and data.
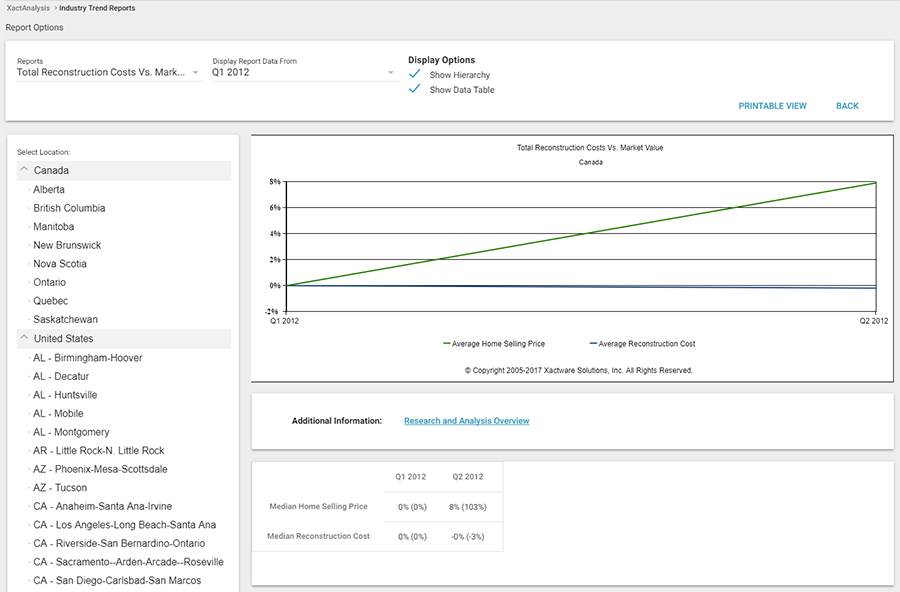
Total Reconstruction Costs Vs. Market Value Report
This report compares the change in median (USA markets) and average (Canadian markets) selling price of single family homes to the change in median/average reconstruction cost.
Several features are available with this report:
Display Report Data From
This menu allows you to change the span of time displayed in the report. You can choose from the past one to five years.
Show Hierarchy
Clear this check box to hide the location hierarchy on the left of the graph.
Show Data Table
Clear this check box to hide the data table below the graph.
Back
Click Back to return to previously viewed reports.
Printable View
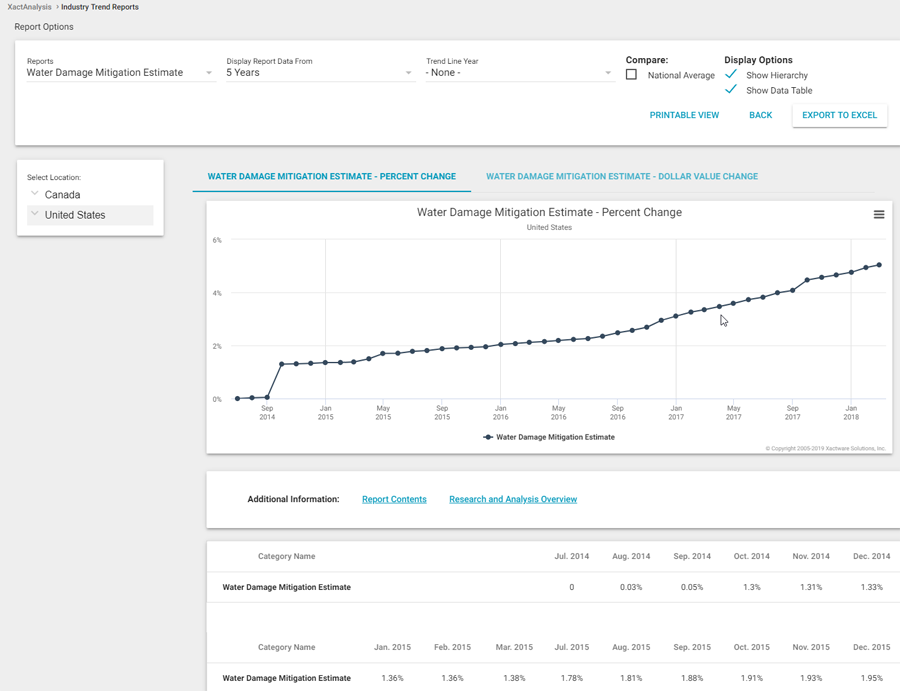
Water Damage Mitigation Estimate Report
This report displays the monthly changes in value of a group of common materials and labor associated with water damage. These changes are shown over a specified number of years. All data in this report is based on building cost data published by Xactware.
For a list of line items that were tracked for this report, click here.
Several features are available with this report:
Percent Change
Click this tab, located above the graph, to view the provided data according to the monthly percent of change from the first month listed.
Dollar Value Change
Click this tab, located above the graph, to view the provided data according to the dollar amount change each month.
Display Report Data From
This menu allows you to change the span of time displayed in the report. You can choose from the past one to five years.
Project Trend Line From
Select a year from this menu to add a line on the graph that represents that year’s industry trend. After selecting a year, a second menu appears that allows you to select a month or quarter of that year from which to start the trend line.
Compare
If you drill down in the hierarchy tree to a location below the national level, one or both of the Compare check boxes become available. When selected, additional plot lines are added to the graph that represent the national or state average.
Show Hierarchy
Clear this check box to hide the location hierarchy on the left of the graph.
Show Data Table
Clear this check box to hide the data table below the graph.
Export to Excel
Click Export to Excel to export the data from the report into an Excel spreadsheet.
Back
Click Back to return to previously viewed reports.
Printable View
Click Printable View to open a new window with a printer-friendly version of the graph and data.
Report Contents
Click this link to open a new window that displays all of the Xactimate price list items that were tracked for this report.
Research and Analysis Overview
Click this link to open a new window that explains how Xactware researches and updates the prices for its price lists.
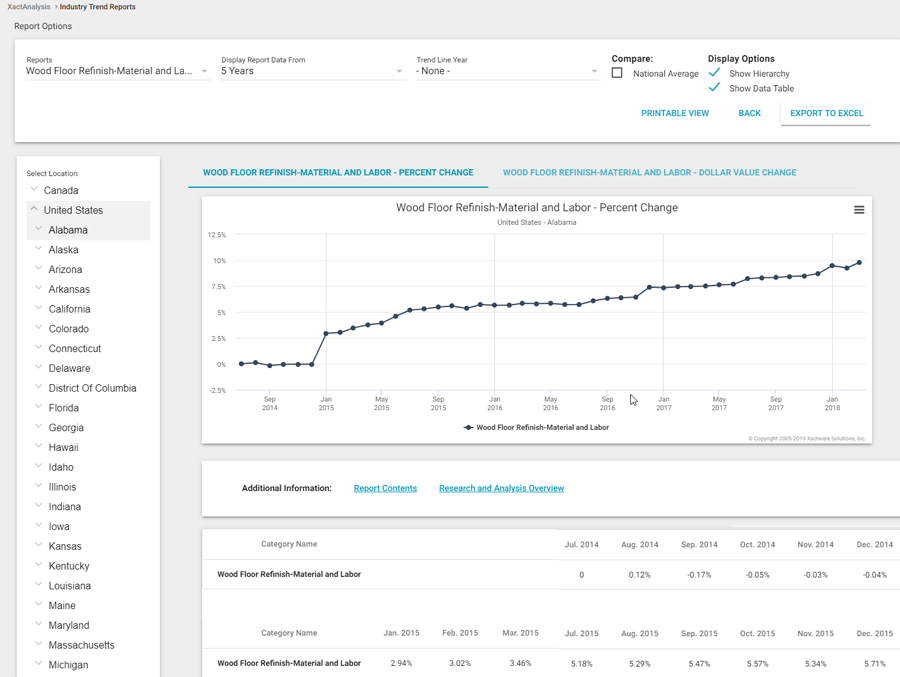
Wood Floor Refinish—Material and Labor Report
This report displays the monthly changes in value of a group of materials and labor associated with refinishing a wood floor. These changes are shown over a specified number of years. All data in this report is based on building cost data published by Xactware.
For a list of line items that were tracked for this report, click here.
Several features are available with this report:
Percent Change
Click this tab, located above the graph, to view the provided data according to the monthly percent of change from the first month listed.
Dollar Value Change
Click this tab, located above the graph, to view the provided data according to the dollar amount change each month.
Display Report Data From
This menu allows you to change the span of time displayed in the report. You can choose from the past one to five years.
Project Trend Line From
Select a year from this menu to add a line on the graph that represents that year’s industry trend. After selecting a year, a second menu appears that allows you to select a month or quarter of that year from which to start the trend line.
Compare
If you drill down in the hierarchy tree to a location below the national level, one or both of the Compare check boxes become available. When selected, additional plot lines are added to the graph that represent the national or state average.
Show Hierarchy
Clear this check box to hide the location hierarchy on the left of the graph.
Show Data Table
Clear this check box to hide the data table below the graph.
Export to Excel
Click Export to Excel to export the data from the report into an Excel spreadsheet.
Back
Click Back to return to previously viewed reports.
Printable View
Click Printable View to open a new window with a printer-friendly version of the graph and data.
Report Contents
Click this link to open a new window that displays all of the Xactimate price list items that were tracked for this report.
Research and Analysis Overview
Click this link to open a new window that explains how Xactware researches and updates the prices for its price lists.
Year over Year Key Composite Trends by Category Report
This report displays the average national change in pricing for key composite categories. All data in this report is based on building cost data published by Xactware.
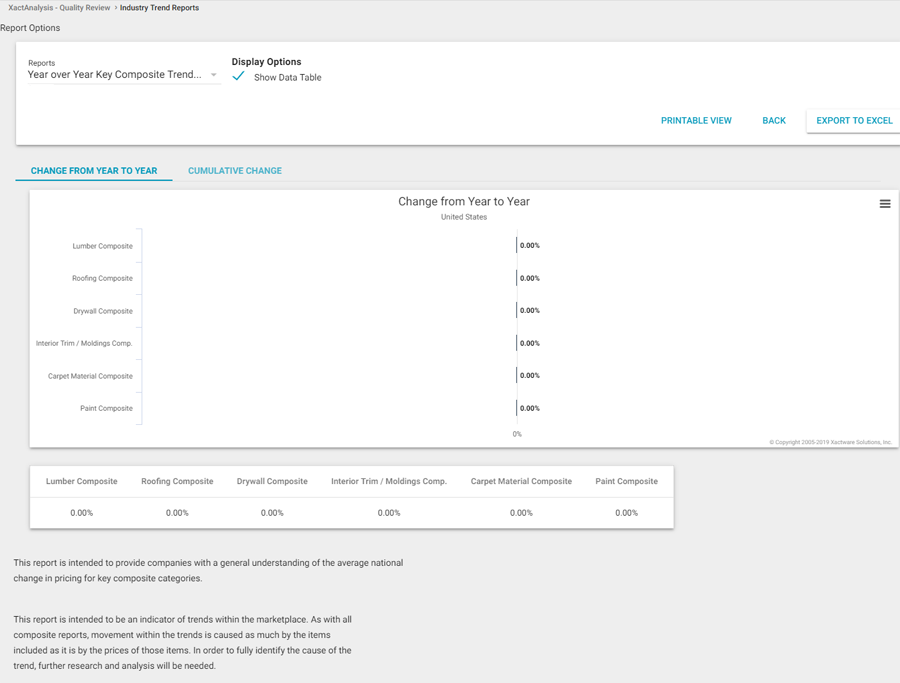
Several features are available with this report:
Change from Year to Year
Click this tab, located above the graph, to view the percent of change in each category for the past year.
Cumulative Change
Click this tab, located above the graph, to view the percent of change each month in each category for the past year.
Show Data Table
Clear this check box to hide the data table below the graph.
Export to Excel
Click Export to Excel to export the data from the report into an Excel spreadsheet.
Back
Click Back to return to previously viewed reports.
Printable View
Click Printable View to open a new window with a printer-friendly version of the graph and data.
Report Contents
Basket of Goods Labor & Materials
|
Quantity |
Unit |
Description |
|
7 |
EA |
Replace |
|
7 |
EA |
Replace |
|
1 |
EA |
R&R Garbage disposer |
|
1 |
EA |
R&R Range hood |
|
1 |
EA |
R&R Refrigerator - top freezer - 18 to 22 cf |
|
1 |
EA |
R&R Range - freestanding - electric |
|
13 |
LF |
Replace Countertop - flat laid plastic laminate |
|
13 |
LF |
R&R Cabinetry - lower (base) units |
|
7.5 |
LF |
R&R Cabinetry - upper (wall) units |
|
3 |
LF |
R&R Vanity |
|
600 |
SF |
R&R Concrete slab on grade - 4" - finished in place |
|
1 |
CY |
R&R Concrete step - labor & material |
|
4 |
EA |
R&R Interior door unit |
|
1 |
EA |
R&R Exterior door - metal - insulated - flush or panel style |
|
1 |
EA |
R&R Bathroom ventilation fan, light, and heater |
|
1 |
EA |
R&R Breaker panel - 100 amp |
|
3 |
EA |
R&R Ground fault interrupter (GFI) outlet |
|
1 |
EA |
R&R 220 volt outlet |
|
27 |
EA |
R&R Outlet |
|
408 |
SF |
Replace Rewire - average residence - copper wiring |
|
319.28 |
SF |
R&R Carpet |
|
292.61 |
SF |
R&R Carpet pad |
|
37.06 |
SF |
R&R Tile floor covering |
|
50 |
SF |
R&R Vinyl floor covering (sheet goods) |
|
87.06 |
SF |
R&R Underlayment - 1/2" BC plywood |
|
140.67 |
LF |
R&R Baseboard - 2 1/4" |
|
35 |
LF |
R&R Casing - 2 1/4" |
|
34 |
LF |
R&R Shelving - 12" - in place |
|
11 |
LF |
R&R Window sill |
|
1 |
EA |
R&R Bath accessory |
|
1 |
EA |
R&R Door lockset & deadbolt - exterior |
|
4 |
EA |
R&R Door knob - interior |
|
158 |
LF |
R&R Stud wall - 2" x 4" x 8' - 16" oc |
|
406.34 |
SF |
R&R Joist - floor or ceiling - 2x10 - w/blocking - 16" oc |
|
406.34 |
SF |
R&R Sheathing - plywood - 3/4" - tongue and groove |
|
1289 |
SF |
R&R Sheathing - waferboard - 1/2" |
|
221 |
LF |
R&R Truss - 6/12 slope |
|
1 |
EA |
R&R Central air conditioning system - 2 ton - up to 13 SEER |
|
1 |
EA |
R&R Ductwork system - hot or cold air - 1200 to 1599 SF home |
|
1 |
EA |
R&R Furnace - forced air - 60 - 75,000 BTU |
|
4 |
EA |
R&R Heat/AC register - Mechanically attached |
|
1 |
EA |
R&R Thermostat |
|
10 |
LF |
R&R Furnace vent - double wall, 5" |
|
408 |
SF |
R&R Blown-in insulation - 10" depth - R26 |
|
656 |
SF |
R&R Batt insulation - 4" - R13 |
|
2 |
EA |
R&R Light fixture |
|
1 |
EA |
R&R Light bar - 3 lights |
|
1 |
EA |
R&R Fluorescent light fixture |
|
1 |
EA |
R&R Exterior light fixture |
|
136 |
SF |
R&R Brick veneer |
|
3 |
LF |
R&R Vanity top - one sink - cultured marble |
|
66 |
SF |
R&R Wall veneer panels - cultured marble |
|
9 |
SF |
R&R Mirror - 1/4" plate glass |
|
2 |
EA |
R&R Sink faucet - Kitchen |
|
408 |
SF |
Replace Rough in plumbing - includes supply and waste lines |
|
1 |
EA |
R&R Sink - double |
|
1 |
EA |
R&R Toilet |
|
1 |
EA |
R&R Toilet seat |
|
1 |
EA |
R&R Tub/shower faucet |
|
1 |
EA |
R&R Bathtub |
|
1 |
EA |
R&R Water heater - 40 gallon - Gas - 6 yr |
|
158 |
LF |
Paint baseboard - two coats |
|
10 |
EA |
Paint door slab only - 2 coats (per side) |
|
10 |
EA |
Paint door/window trim & jamb - 2 coats (per side) |
|
1678.33 |
SF |
Paint {V} - two coats |
|
6.33 |
SQ |
R&R 3 tab - 25 yr. - composition shingle roofing - incl. felt |
|
2 |
EA |
Replace Flashing - pipe jack |
|
520 |
SF |
R&R Siding - vinyl |
|
82 |
LF |
R&R Gutter / downspout - aluminum - up to 5" |
|
82 |
LF |
R&R Soffit & fascia - metal - 2' overhang |
|
40 |
SF |
R&R Metal lath & stucco |
|
1 |
EA |
R&R Vinyl window, picture/fixed, 24-32 sf |
|
1 |
EA |
R&R Vinyl window, single hung, 9-12 sf |
|
1 |
EA |
R&R Vinyl window, single hung, 13-19 sf |
Basket of Goods Material Only
|
Quantity |
Unit |
Description |
|
1 |
EA |
Garbage disposer |
|
1 |
EA |
Range hood |
|
1 |
EA |
Refrigerator - top freezer - 18 to 22 cf |
|
1 |
EA |
Range - freestanding - electric |
|
.12 |
GL |
Contact cement |
|
28.89 |
SF |
Plastic laminate - general purpose (.039") standard colors |
|
13 |
LF |
Cabinetry - lower unit - picture-frame doors |
|
.9 |
SH |
3/4" industrial grade particle board |
|
7.5 |
LF |
Cabinetry - upper unit - picture-frame doors |
|
3 |
LF |
Vanity |
|
9.28 |
CY |
Concrete - 6 bag mix |
|
4 |
EA |
Interior door - Colonist - pre-hung unit |
|
1 |
EA |
Exterior door - metal flush or 6 panel - pre-hung unit |
|
1 |
EA |
Bathroom fan, light, and heater |
|
9.79 |
EA |
Electrical box - steel - single gang |
|
.54 |
EA |
Electrical box - steel - double gang |
|
1 |
EA |
Breaker panel - 100 amp |
|
12.05 |
EA |
Circuit breaker - 110 volt - single pole |
|
2 |
EA |
Circuit breaker - 220 volt - double pole |
|
27 |
EA |
Outlet or switch cover |
|
1 |
EA |
220 volt outlet cover |
|
3 |
EA |
Ground fault interrupter (GFI) outlet |
|
1 |
EA |
220 volt outlet |
|
.54 |
EA |
Outlet box - includes 4 connectors and plaster ring |
|
27 |
EA |
Outlet, 15 amp - residential grade |
|
229.05 |
LF |
110 volt copper wiring (12/2 with ground) |
|
8.59 |
LF |
220 volt copper wiring (8/3 with ground) |
|
319.28 |
SF |
Carpet - Allowance |
|
292.61 |
SF |
Carpet pad - rebond, 6 lb |
|
.21 |
BX |
Carpet tackless strip - 400 lf/box |
|
1.01 |
RL |
Carpet seaming tape - 66 lf per roll |
|
41.18 |
SF |
Ceramic floor tile |
|
11.58 |
LF |
1" x 3" finger-jointed pine - S4S |
|
51.13 |
LF |
1" x 4" Select grade pine - S4S |
|
148.07 |
LF |
Baseboard - 2 1/4" finger-joint pine |
|
206.02 |
LF |
Casing - 2 1/4" |
|
35.79 |
LF |
12" particle board shelving |
|
.84 |
BN |
Wood shims |
|
1 |
EA |
Deadbolt |
|
4 |
EA |
Door passage or lockset - interior |
|
1 |
EA |
Door lockset - exterior |
|
1 |
EA |
Towel bar |
|
463.57 |
LF |
Fir/Larch, 2x10 #2 & better |
|
194.37 |
LF |
Fir/Larch, 2x4 #2 & better |
|
499.45 |
LF |
Fir/Larch, 2x4x16 #2 & better - plate material |
|
182.36 |
EA |
Fir/Larch, 2x4x8 #2 & better - pre-cut stud |
|
8.5 |
EA |
Hurricane tie |
|
44.76 |
SH |
Sheathing - waferboard - 1/2" |
|
221 |
LF |
Truss - 6/12 slope |
|
3.02 |
SH |
Plywood, 1/2"BC |
|
1 |
EA |
Central air - condenser unit - 2 ton - up to 13 SEER |
|
1 |
EA |
Evaporator coil, 2 ton |
|
1 |
EA |
Line set for AC unit 50' (3/8" & 3/4" tubing w/insulation) |
|
4 |
EA |
Heat/AC register |
|
1 |
EA |
Thermostat |
|
26.32 |
LF |
Thermostat cable, 5 conductor (based on 250 ft roll) |
|
10 |
LF |
Gas vent pipe - Double wall, 5" |
|
.56 |
EA |
Gas vent - Flashing, 5" |
|
1.11 |
EA |
Gas vent - Fire stop, 6" |
|
1.11 |
EA |
Gas vent Tee - Double wall, 5" |
|
.56 |
EA |
Gas vent - Aluminum tee cap, 5" |
|
8.17 |
BG |
Blown in insulation - Per 30 lb bag |
|
690.53 |
SF |
Insulation - R-13 "Kraft" faced batt |
|
.97 |
EA |
3/8" Staples - 1000 count box |
|
2 |
EA |
Light fixture |
|
1 |
EA |
Light bar - 3 lights |
|
1 |
EA |
Fluorescent light fixture |
|
1 |
EA |
Exterior light fixture |
|
1022.63 |
EA |
Brick veneer |
|
5.04 |
BG |
Mortar mix - 80# bag |
|
.18 |
CY |
Washed sand |
|
9.75 |
EA |
16 gauge wall ties |
|
3 |
LF |
Vanity top - one sink - cultured marble |
|
63.53 |
SF |
Wall veneer panels - cultured marble |
|
9 |
SF |
Mirror - 1/4" plate glass |
|
12.66 |
LB |
1 1/4" roofing barbs, (based on 50 lb box) |
|
1.34 |
BX |
16d nails for nail gun - 2000 count box |
|
.86 |
LB |
6d colored ring shank nails |
|
15.99 |
LB |
6d finish nails (based on 5 lb box) |
|
22.4 |
LB |
8d smooth box nails, (based on 50 lb box) |
|
.27 |
BX |
1/4" crown, 18 gauge staples for air gun, approx 5000 count |
|
42.11 |
SF |
Metal lath for plaster application |
|
1 |
EA |
|
|
1 |
EA |
Brass bolts used to secure bowl to the floor - two |
|
1 |
EA |
1 1/2", 20 gauge, end joint continuous waste |
|
1 |
EA |
Drain set for bath tub - 20 gauge brass |
|
2 |
EA |
Sink faucet - Kitchen |
|
1 |
EA |
Pressure relief valve for water heater |
|
1 |
EA |
"P" trap with flange, 1 1/2" ABS |
|
408 |
SF |
Rough in plumbing - includes supply and waste line |
|
2 |
EA |
3/4" flexible copper supply tube - 24" long |
|
5 |
EA |
3/8" OD x 15" chrome or stainless steel supply line |
|
1 |
EA |
Sink - double bowl |
|
2 |
EA |
3 1/2" basket strainer & drain assembly - chrome |
|
1 |
EA |
Toilet |
|
1 |
EA |
Toilet seat |
|
1 |
EA |
Tub/shower faucet complete w/valve |
|
1 |
EA |
Bathtub |
|
1 |
EA |
Wax ring closet gasket |
|
1 |
EA |
Water heater - 40 gallon - Gas - 6 yr |
|
2.57 |
TB |
Caulking - acrylic |
|
12.36 |
GL |
Latex paint |
|
.31 |
GL |
Painter's putty |
|
13.84 |
SH |
160 - 180 grit sandpaper - per sheet |
|
6.33 |
SQ |
Composition shingles - 25 year - 3 tab |
|
1.69 |
RL |
15 lb ASTM roofing felt |
|
4.52 |
LB |
Simplex roofing felt cap nails - (based on 50 lb box) |
|
2 |
EA |
Flashing - pipe jack - galvanized or plastic - up to 4" |
|
.63 |
BX |
Wood screw - #10x2", 1 lb. box |
|
91.11 |
LF |
Metal "J" trim used around openings |
|
577.78 |
SF |
Siding - vinyl |
|
288.89 |
LF |
Vinyl "J" trim used around openings |
|
19.26 |
LF |
Vinyl outside corner trim |
|
91.11 |
LF |
Fascia - metal, 6" |
|
91.11 |
LF |
Gutter/downspout - aluminum |
|
182.22 |
SF |
Soffit - metal or vinyl |
|
.82 |
BG |
Stucco - base coat mix |
|
.37 |
BG |
Stucco - color coat mix |
|
.59 |
BG |
Ceramic tile grout - 25 lb bag |
|
1.02 |
GL |
Tile Mastic |
|
.59 |
BG |
Thinset - multipurpose latex fortified - 50 lb bag |
|
1 |
EA |
Vinyl window - picture, 24-33 sf |
|
1 |
EA |
Vinyl window, single hung, 9-12 sf |
|
1 |
EA |
Vinyl window, single hung, 13-19 sf |
Carpet Material Composite
|
Quantity |
Unit |
Description |
|
400 |
SF |
Carpet - Allowance |
|
400 |
SF |
Carpet - High grade - Allowance |
|
1 |
EA |
Metal transition strip - 12' |
|
400 |
SF |
Glue down carpet - Allowance |
|
400 |
SF |
Carpet pad - rebond, 6 lb |
|
400 |
SF |
Carpet pad - rebond, 8 lb |
|
.5 |
BX |
Carpet tackless strip - 400 lf/box |
|
.5 |
RL |
Carpet seaming tape - 66 lf per roll |
Carpet Replacement-Material and Labor
|
Quantity |
Unit |
Description |
|
1 |
EA |
Contents - move out then reset |
|
1 |
EA |
Haul debris - per pickup truck load - including dump fees |
|
2 |
EA |
Replace Interior door - Detach & reset - slab only |
|
144 |
SF |
R&R Carpet |
|
1 |
EA |
Painting - Minimum charge |
Contents Packout & Cleaning
|
Quantity |
Unit |
Description |
|
1 |
EA |
Clean blender |
|
1 |
EA |
Clean coffee pot - electric |
|
1 |
EA |
Clean dryer - exterior |
|
1 |
EA |
Clean iron |
|
16 |
HR |
Cleaning Technician - incl. cleaning agent - per hour |
|
1 |
EA |
Clean microwave - exterior |
|
1 |
EA |
Clean refrigerator - exterior |
|
2 |
EA |
Clean small appliances (countertop) |
|
1 |
EA |
Clean washer - exterior |
|
1 |
EA |
Clean calculator (electronic) - exterior wipe down |
|
1 |
EA |
Clean CD player - exterior wipe down |
|
1 |
EA |
Clean computer sys. (CPU/monitor/key) - exterior wipe down |
|
1 |
EA |
Clean computer printer - small (desk top) - ext. wipe down |
|
2 |
EA |
Clean telephone - exterior wipe down |
|
2 |
EA |
Clean clock radio - portable - exterior wipe down |
|
1 |
EA |
Clean stereo - components - amplifier - exterior wipe down |
|
1 |
EA |
Clean television - exterior wipe down |
|
1 |
EA |
Clean television - large screen - exterior wipe down |
|
2 |
EA |
Clean remote control - exterior wipe down |
|
1 |
EA |
Clean video game unit - w/controllers - exterior wipe down |
|
1 |
EA |
Clean armoire (wardrobe) contents |
|
20 |
LF |
Clean bookcase contents |
|
4 |
EA |
Clean bookpack - per box |
|
5 |
EA |
Clean bric-a-brac - per Med box |
|
5 |
EA |
Clean dishpack - per box |
|
5 |
EA |
Clean glasspack - per box |
|
3 |
EA |
Clean pots and pans - per medium box |
|
24 |
LF |
Clean cabinet contents - kitchen |
|
6 |
LF |
Clean closet contents (no clothing) |
|
3 |
LF |
Clean desk contents |
|
5 |
LF |
Clean dresser contents |
|
3 |
EA |
Clean luggage - average size |
|
1 |
EA |
Clean medicine cabinet contents |
|
3 |
EA |
Clean night stand contents |
|
3 |
EA |
Clean plant |
|
8 |
LF |
Clean vanity contents |
|
3 |
LF |
Clean wall shelf unit contents |
|
4 |
EA |
Clean bar stool |
|
3 |
EA |
Clean bed frame |
|
1 |
EA |
Clean footboard - large size |
|
2 |
EA |
Clean footboard - double bed |
|
1 |
EA |
Clean headboard - large size |
|
2 |
EA |
Clean headboard - double bed |
|
30 |
SF |
Clean bookcase (per sf of face area) |
|
6 |
EA |
Clean chair - dining |
|
1 |
EA |
Clean desk |
|
1 |
EA |
Clean dresser - single |
|
1 |
EA |
Clean dresser - double |
|
1 |
EA |
Clean dresser mirror |
|
4 |
LF |
Clean entertainment center |
|
3 |
EA |
Clean night stand |
|
1 |
EA |
Clean piano - console (upright) |
|
1 |
EA |
Clean piano stool |
|
1 |
EA |
Clean table - coffee |
|
1 |
EA |
Clean table - dining |
|
3 |
LF |
Clean wall shelf unit |
|
10000 |
CF |
Deodorize building - Ozone treatment |
|
8 |
HR |
Content Manipulation charge - per hour |
|
350 |
LF |
Bubble Wrap - Add-on cost for fragile items |
|
25 |
EA |
Provide box, packing paper & tape - medium size |
|
20 |
EA |
Provide box, packing paper & tape - small size |
|
5 |
EA |
Provide dishpack box, packing paper & tape |
|
5 |
EA |
Provide glasspack box, packing paper & tape |
|
2 |
EA |
Provide plastic chair cover & packing tape |
|
4 |
EA |
Provide plastic couch/sofa cover & packing tape |
|
2 |
EA |
Provide plastic mattress cover & packing tape - Full size |
|
1 |
EA |
Provide plastic mattress cover & packing tape - Queen size |
|
32 |
HR |
Inventory, Packing, Boxing, and Moving charge - per hour |
|
8 |
HR |
Contents Evaluation and/or Supervisor/Admin - per hour |
|
15 |
EA |
Provide furniture lightweight blanket/pad |
|
120 |
SF |
Off-site storage & insurance - per month |
|
200 |
SF |
Off-site storage & insur. - climate controlled - per month |
|
2 |
EA |
Moving van (17' - 20') and equipment - per day |
|
1 |
RL |
Provide stretch film/wrap |
|
2 |
EA |
Clean chair |
|
1 |
EA |
Clean office chair |
|
5 |
LF |
Clean loveseat - plain fabric |
|
2 |
EA |
Clean & deodorize mattress or box spring - full |
|
1 |
EA |
Clean & deodorize mattress or box spring - queen |
|
3 |
LF |
Clean and deodorize ottoman - plain fabric |
|
10 |
EA |
Clean and deodorize pillow |
|
20 |
SF |
Clean rug - domestic - on site |
|
8 |
LF |
Clean sofa |
|
8 |
LF |
Clean sofa - leather |
Drywall Material Composite
|
Quantity |
Unit |
Description |
|
320 |
SF |
Gypsum board, 1/2" |
|
320 |
SF |
Water-resistant gypsum board (greenboard), 1/2" |
|
320 |
SF |
Gypsum board, 5/8" type X |
|
80 |
LF |
Metal corner bead |
|
1 |
BX |
Drywall joint compound - 50 lb box |
|
1 |
RL |
Perfotape - 500' roll |
Fire Damage - Medium Size
|
Quantity |
Unit |
Description |
|
1 |
EA |
R&R Refrigerator - top freezer - 22 to 25 cf |
|
18.23 |
SF |
R&R Countertop - solid surface |
|
8.75 |
LF |
R&R Backsplash - solid surface - Unattached |
|
8.5 |
LF |
R&R Cabinetry - lower (base) units |
|
8.5 |
LF |
R&R Cabinetry - upper (wall) units |
|
7548 |
SF |
Clean {V} |
|
584.89 |
LF |
Clean baseboard |
|
13.42 |
LF |
Clean balustrade |
|
1 |
EA |
Clean light bar |
|
137.78 |
SF |
Clean window blind - horizontal or vertical |
|
5123.5 |
SF |
Clean concrete on {V} |
|
72.03 |
SF |
Clean countertop |
|
33856 |
CF |
Deodorize building - Ozone treatment |
|
24 |
EA |
Clean door (per side) |
|
15 |
EA |
Clean door hardware |
|
1 |
EA |
Clean dishwasher - interior and exterior |
|
2 |
EA |
Clean exhaust fan |
|
1015.6 |
SF |
Clean and deodorize carpet |
|
164.96 |
SF |
Clean floor - tile |
|
5.67 |
LF |
Clean cabinetry - full height - inside and out |
|
4 |
LF |
Clean cabinetry - full height - faces only |
|
13.42 |
LF |
Clean handrail - wall mounted |
|
35 |
EA |
Clean light fixture |
|
25.33 |
LF |
Clean cabinetry - lower - inside and out |
|
41.5 |
SF |
Clean mirror |
|
1 |
EA |
Clean microwave - over range - interior and exterior |
|
30 |
EA |
Clean door / window opening (per side) |
|
1 |
EA |
Clean shower door |
|
50.62 |
LF |
Clean sill - cultured marble |
|
3 |
EA |
Clean sink |
|
1 |
EA |
Clean sink - double |
|
1 |
EA |
Clean storm door (per side) |
|
1 |
EA |
Clean shower |
|
3 |
EA |
Clean towel bar |
|
2 |
EA |
Clean toilet |
|
2 |
EA |
Clean toilet paper dispenser |
|
2 |
EA |
Clean tub and surround |
|
15.92 |
LF |
Clean cabinetry - upper - inside and out |
|
10.25 |
LF |
Clean vanity - faces only |
|
10 |
EA |
Clean window unit (per side) 10 - 20 SF |
|
4 |
EA |
Clean window unit (per side) 3 - 9 SF |
|
3 |
EA |
Clean window unit (per side) 21 - 40 SF |
|
6 |
EA |
Clean exterior door (per side) |
|
1 |
EA |
Dumpster load - Approx. 30 yards, 5-7 tons of debris |
|
3 |
EA |
R&R Interior door unit |
|
5286.5 |
SF |
R&R 1/2" drywall - hung, taped, floated, ready for paint |
|
10 |
EA |
R&R 110 volt copper wiring run, box and outlet |
|
1 |
EA |
R&R Ground fault interrupter (GFI) outlet |
|
249.49 |
SF |
R&R Carpet |
|
168.52 |
SF |
Replace Carpet pad |
|
17 |
EA |
Replace Step charge for "tucked" carpet installation - High grade |
|
184.83 |
SF |
R&R Oak flooring - #1 common - no finish |
|
561.22 |
SF |
Replace Sand & finish wood floor (natural finish) |
|
30.52 |
LF |
R&R Baseboard - 3 1/4" |
|
12.67 |
LF |
R&R Handrail - detailed profile - softwood - wall mounted |
|
1 |
EA |
R&R Door knob - interior |
|
80.88 |
LF |
R&R Stud wall - 2" x 4" x 8' - 16" oc |
|
155 |
LF |
Remove Joist - floor or ceiling - 2x10 - w/blocking |
|
387.61 |
LF |
Replace Joist - floor or ceiling - 2x10 - w/blocking |
|
169.05 |
SF |
R&R Sheathing - plywood - 3/4" - tongue and groove |
|
20 |
LF |
R&R Ductwork - hot or cold air - Large size |
|
1 |
EA |
R&R Furnace - forced air - 100,000 BTU |
|
1 |
EA |
R&R Humidifier unit |
|
228.74 |
SF |
R&R Blown-in insulation - 12" depth - R30 |
|
540.67 |
SF |
R&R Batt insulation - 4" - R11 |
|
1749.6 |
SF |
R&R Batt insulation - 6" - R19 |
|
2 |
EA |
R&R Light fixture - Standard grade |
|
20 |
LF |
R&R Water supply line - copper with fitting and hanger, 3/4" |
|
1 |
EA |
R&R Water heater - 50 gallon - Gas - 6 yr |
|
228.74 |
SF |
Seal attic framing (shellac) - up to 5/12 |
|
105.95 |
SF |
Paint concrete {V} |
|
1 |
EA |
Prime & paint ductwork system - hot or cold air |
|
7 |
EA |
Paint door slab only - 2 coats (per side) |
|
8 |
EA |
Paint door/window trim & jamb - 2 coats (per side) |
|
2021.7 |
SF |
Seal floor or ceiling joist sys. (shellac) |
|
172.9 |
SF |
Scrape {V} & prep for paint |
|
396.66 |
SF |
Seal/prime then paint {V} (2 coats) |
|
502.83 |
SF |
Seal stud wall for odor control |
|
1 |
EA |
R&R Stairway - 4' wide (8' rise plus joist) |
Garage Door Replacement-Mat. and Labor
|
Quantity |
Unit |
Description |
|
1 |
EA |
Haul debris - per pickup truck load - including dump fees |
|
1 |
EA |
R&R Overhead door & hardware - 16' x 7' |
|
1 |
EA |
Replace Overhead (garage) door opener - Detach & reset |
Int. Door Replacement-Material and Labor
|
Quantity |
Unit |
Description |
|
1 |
EA |
R&R Interior door unit |
|
1 |
EA |
Replace Door knob - interior |
|
2 |
EA |
Paint door slab only - 2 coats (per side) |
|
2 |
EA |
Paint door/window trim & jamb - 2 coats (per side) |
Interior Trim Material Composite
|
Quantity |
Unit |
Description |
|
3 |
EA |
Interior door - birch - slab only |
|
3 |
EA |
Interior door - Colonist - slab only |
|
255 |
LF |
Wood door jamb stock - finger-jointed pine, 4 9/16" |
|
3 |
EA |
Interior door - mahogany - slab only |
|
3 |
EA |
Interior door - oak - flush - slab only |
|
3 |
EA |
Interior door slab - paneled pine/fir - avg. grade |
|
50 |
LF |
Baseboard - 2 1/4" finger-joint pine |
|
50 |
LF |
Baseboard - 3 1/4" finger-jointed pine |
|
50 |
LF |
Baseboard - 3 1/2" hardwood |
|
50 |
LF |
Baseboard - 3 1/2" hardwood - molded w/ detail |
|
50 |
LF |
Baseboard - 6" stain-grade fir |
|
50 |
LF |
Baseboard - 6" hardwood |
|
50 |
LF |
Casing - 2 1/4" |
|
50 |
LF |
Casing - 3 1/4" |
|
50 |
LF |
Casing - hardwood - 2 1/4" |
|
50 |
LF |
Casing - hardwood - 2 1/4" w/detail |
|
50 |
LF |
Chair rail - 2 1/2" finger-jointed pine |
|
50 |
LF |
Chair rail - oversized |
|
50 |
LF |
Chair rail - hardwood |
|
50 |
LF |
Chair rail - hardwood - w/detail |
|
50 |
LF |
Cove molding - 3/4" |
|
50 |
LF |
Cove molding - 3/4" hardwood |
|
50 |
LF |
Corner trim |
|
50 |
LF |
Corner trim - hardwood |
|
50 |
LF |
Crown molding |
|
50 |
LF |
Crown molding - oversized |
|
50 |
LF |
Crown molding - hardwood |
|
50 |
LF |
Shoe molding |
|
50 |
LF |
Shoe molding - hardwood |
Kitchen Smoke Damage
|
Quantity |
Unit |
Description |
|
1 |
EA |
Replace Dishwasher - Detach & reset |
|
1 |
EA |
R&R Range hood |
|
1 |
EA |
Replace Refrigerator - Remove & reset |
|
1 |
EA |
Replace Range - electric - Remove & reset |
|
10 |
LF |
R&R Cabinetry - upper (wall) units |
|
1656 |
SF |
Clean {V} |
|
20 |
SF |
Clean countertop |
|
16000 |
CF |
Deodorize building - Ozone treatment |
|
6 |
EA |
Clean door (per side) |
|
1 |
EA |
Clean dishwasher - interior and exterior |
|
280 |
SF |
Clean floor, strip & wax |
|
288 |
SF |
Clean and deodorize carpet |
|
3 |
EA |
Clean light fixture |
|
20 |
LF |
Clean cabinetry - lower - inside and out |
|
1 |
EA |
Clean refrigerator - interior and exterior |
|
1 |
EA |
Clean range - interior and exterior |
|
1 |
EA |
Clean sink - double |
|
8 |
LF |
Clean cabinetry - upper - inside and out |
|
4 |
EA |
Clean window unit (per side) 10 - 20 SF |
|
1 |
EA |
Contents - move out then reset - Large room |
|
1 |
EA |
Haul debris - per pickup truck load - including dump fees |
|
1 |
EA |
R&R 110 volt copper wiring run, box and outlet |
|
2 |
EA |
R&R Light fixture |
|
1656 |
SF |
Seal/prime then paint {V} (2 coats) |
|
68 |
LF |
R&R Wallpaper border |
Lumber Material Composite
|
Quantity |
Unit |
Description |
|
60 |
LF |
1" x 10" #2 pine |
|
50 |
LF |
1" x 12" #2 pine |
|
300 |
LF |
1" x 2" All-purpose S-P-F furring strip |
|
150 |
LF |
1" x 4" All-purpose S-P-F furring strip |
|
100 |
LF |
1" x 6" #2 or better pine |
|
75 |
LF |
1" x 8" #2 or better pine |
|
90 |
LF |
Fir/Larch, 2x10 #2 & better |
|
90 |
LF |
2" x 10" - treated lumber |
|
75 |
LF |
Fir/Larch, 2x12 #2 & better |
|
75 |
LF |
2" x 12" - treated lumber |
|
75 |
LF |
Fir/Larch, 2x4 #2 & better |
|
75 |
LF |
Fir/Larch, 2x4x16 #2 & better - plate material |
|
9.72 |
EA |
Fir/Larch, 2x4x8 #2 & better - pre-cut stud |
|
150 |
LF |
2" x 4" - treated lumber |
|
50 |
LF |
Fir/Larch, 2x6 #2 & better |
|
50 |
LF |
Fir/Larch, 2x6x16 #2 & better - plate material |
|
6.48 |
EA |
Fir/Larch, 2x6x8 #2 & better - pre-cut stud |
|
100 |
LF |
2" x 6" - treated lumber |
|
225 |
LF |
Fir/Larch, 2x8 #2 & better |
|
75 |
LF |
2" x 8" - treated lumber |
|
75 |
LF |
Fir timber - 4" x 4" |
|
112.5 |
LF |
Fir timber - treated, 4" x 4" |
|
50 |
LF |
Fir timber - 4" x 6" |
|
37.5 |
LF |
Fir timber - 4" x 8" |
|
50 |
LF |
6" x 6" square wood post - treated |
|
10 |
SH |
Sheathing - plywood - 1/2" CDX |
|
10 |
SH |
Sheathing - plywood - 3/4" - CDX |
|
10 |
SH |
Sheathing - plywood - 5/8" - CDX |
|
10 |
SH |
Sheathing - waferboard - 1/2" |
|
10 |
SH |
Sheathing - waferboard - 5/8" |
Paint Material Composite
|
Quantity |
Unit |
Description |
|
1 |
GL |
Latex paint |
|
1 |
RL |
Masking paper, 12" roll |
|
1 |
RL |
Masking tape, 3/4" roll |
|
1 |
GL |
Oil base paint |
|
1 |
GL |
Oil base sealer/primer |
|
1 |
GL |
Sealer - stain blocker - latex based |
|
1 |
GL |
Oil base stain |
|
1 |
GL |
Paint/varnish stripper |
|
1 |
GL |
Exterior latex |
|
1 |
GL |
Exterior stain |
Retail Labor
|
Quantity |
Unit |
Description |
|
1 |
HR |
Carpenter - Finish, Trim/Cabinet |
|
1 |
HR |
Carpenter - General Framer |
|
1 |
HR |
Carpenter - Mechanic |
|
1 |
HR |
Cleaning Technician |
|
1 |
HR |
Floor Cleaning Technician |
|
1 |
HR |
Concrete Mason |
|
1 |
HR |
Drywall Installer/Finisher |
|
1 |
HR |
Electrician |
|
1 |
HR |
Equipment Operator |
|
1 |
HR |
Flooring Installer |
|
1 |
HR |
Heating / A.C. Mechanic |
|
1 |
HR |
Insulation Installer |
|
1 |
HR |
General Laborer |
|
1 |
HR |
Mason Brick/Stone |
|
1 |
HR |
Plasterer |
|
1 |
HR |
Plumber |
|
1 |
HR |
Painter |
|
1 |
HR |
Roofer |
|
1 |
HR |
Tile/Cultured Marble Installer |
Retail Labor Definitions
Wage
Wage is defined as the prevailing amount paid in the geographic area for a skilled tradesperson with at least 8 years experience.
Labor Burden
Labor Burden includes the following factors: worker compensation (advisory rates), FICA, Federal and State Unemployment tax, general liability insurance, pollution liability insurance, and fringe benefits (vacation, sick, holiday, group medical).
Labor Overhead
Labor Overhead is determined by direct surveys with contractors and includes any additional costs, overhead, or markup not included elsewhere in the unit price or the general O&P applied to the end of the estimate. Examples of labor overhead costs which a contractor may include in the reported Labor Overhead are (but not limited to): vehicle costs, cell phones, pagers, uniforms, depreciation on hand tools, insurance, etc.
Roof 25 yr Shingle - Labor & Materials
|
Quantity |
Unit |
Description |
|
46.33 |
SQ |
R&R 3 tab - 25 yr. - composition shingle roofing - incl. felt |
|
310 |
LF |
R&R Drip edge |
|
3 |
EA |
R&R Flashing - pipe jack |
|
931 |
SF |
Replace Ice & water shield |
|
129 |
LF |
Replace Ridge cap - composition shingles |
|
15 |
LF |
Replace Step flashing |
|
6 |
EA |
R&R Roof vent - turtle type - Metal |
|
110 |
LF |
R&R Valley metal |
Roofing Material Composite
|
Quantity |
Unit |
Description |
|
5 |
SQ |
Composition shingles - 20 year - 3 tab |
|
5 |
SQ |
Composition shingles - 25 year - 3 tab |
|
2 |
RL |
90 lb roll roofing - 36" x 36' roll |
|
10 |
EA |
Drip edge - painted aluminum, 10' lengths |
|
2 |
RL |
15 lb ASTM roofing felt |
|
3 |
SQ |
Wood shakes - medium (1/2") handsplit - cedar |
|
3 |
SQ |
Wood shakes - medium (1/2") handsplit - fire retardant cedar |
|
3 |
SQ |
Tile roofing - Clay - "S" or flat tile |
|
3 |
SQ |
Tile roofing - High grade - Clay barrel tile |
|
2 |
EA |
Roof vent - turtle type - metal |
Small Bathroom Water Loss
|
Quantity |
Unit |
Description |
|
3 |
LF |
Replace Countertop - flat laid plastic laminate - Detach & reset |
|
3 |
LF |
Replace Vanity - Detach & reset |
|
1 |
EA |
R&R Interior door unit |
|
128 |
SF |
R&R 1/2" drywall - hung, taped, floated, ready for paint |
|
64 |
SF |
R&R Vinyl floor covering (sheet goods) |
|
32 |
LF |
R&R Baseboard - 2 1/4" |
|
32 |
LF |
R&R Base shoe |
|
1 |
EA |
Replace Door lockset - Detach & reset |
|
64 |
SF |
R&R Underlayment - 1/2" particle board |
|
1 |
EA |
Replace Toilet - Detach & reset |
|
32 |
LF |
Paint baseboard - two coats |
|
2 |
EA |
Paint door slab only - 2 coats (per side) |
|
2 |
EA |
Paint door/window trim & jamb - 2 coats (per side) |
|
320 |
SF |
Seal/prime then paint {V} (2 coats) |
|
2 |
EA |
Air mover (per 24 hour period) - No monitoring |
|
64 |
SF |
Water extraction from floor |
Small Hail Loss
|
Quantity |
Unit |
Description |
|
1 |
EA |
Haul debris - per pickup truck load - including dump fees |
|
1 |
EA |
R&R Storm door assembly |
|
5.33 |
SQ |
R&R 3 tab - 25 yr. - composition shingle roofing - incl. felt |
|
60 |
LF |
R&R Drip edge |
|
1 |
EA |
Replace Flashing - pipe jack |
|
240 |
SF |
R&R Siding - vinyl |
|
30 |
LF |
R&R Fascia - metal - 6" |
|
40 |
LF |
R&R Gutter / downspout - aluminum - up to 5" |
|
1 |
EA |
R&R Vinyl window, horizontal sliding, 12-23 sf |
Small Vandalism Loss
|
Quantity |
Unit |
Description |
|
2 |
HR |
General clean - up |
|
1 |
EA |
Haul debris - per pickup truck load - including dump fees |
|
1 |
EA |
R&R Exterior door - metal - insulated - flush or panel style |
|
144 |
SF |
R&R 1/2" drywall - hung, taped, floated, ready for paint |
|
1 |
EA |
Replace Door lockset & deadbolt - exterior |
|
2 |
EA |
Paint door/window trim & jamb - 2 coats (per side) |
|
144 |
SF |
Seal/prime then paint {V} (2 coats) |
|
2 |
EA |
Prime & paint door slab only - exterior (per side) |
Vinyl Flooring Material Composite
|
Quantity |
Unit |
Description |
|
200 |
SF |
Vinyl floor - Allowance |
|
200 |
SF |
Vinyl floor - High grade - Allowance |
|
2.5 |
GL |
Vinyl floor adhesive - 1 gallon |
|
1 |
BX |
Floor patching compound - 5 lb box |
|
1 |
BX |
Vinyl floor tile - Average grade |
|
1 |
BX |
Vinyl floor tile - High grade |
Water Damage Mitigation Estimate
|
Quantity |
Unit |
Description |
|
144 |
SF |
Clean floor |
|
144 |
SF |
Clean and deodorize carpet |
|
1 |
EA |
Contents - move out then reset - Large room |
|
1 |
EA |
Haul debris - per pickup truck load - including dump fees |
|
1 |
EA |
Block and pad furniture in room |
|
2 |
EA |
Dehumidifier (per 24 hour period) - No monitoring |
|
2 |
EA |
Air mover (per 24 hour period) - No monitoring |
|
3 |
HR |
Equipment setup, take down, and monitoring (hourly charge) |
|
1 |
EA |
Emergency service call - after business hours |
|
144 |
SF |
Water extraction from floor |
|
144 |
SF |
Apply anti-microbial agent |
|
144 |
SF |
Lift carpet for drying |
|
144 |
SF |
Tear out wet carpet pad and bag for disposal |
Wood Floor Refinish-Material and Labor
|
Quantity |
Unit |
Description |
|
1 |
EA |
Contents - move out then reset |
|
144 |
SF |
Replace Sand, stain, and finish wood floor |
|
48 |
LF |
Replace Baseboard - Detach and reset |
|
49 |
SF |
Mask {V} per square foot - plastic and tape - 4 mil |
|
1 |
EA |
Painting - Minimum charge |