SpotIQ
SpotIQ helps you view your data’s trends, outliers, and correlations. This feature runs automatically, but you can also run it manually, focusing it to better meet your needs. The more often you run SpotIQ and submit feedback, the better your results will be.
Run SpotIQ

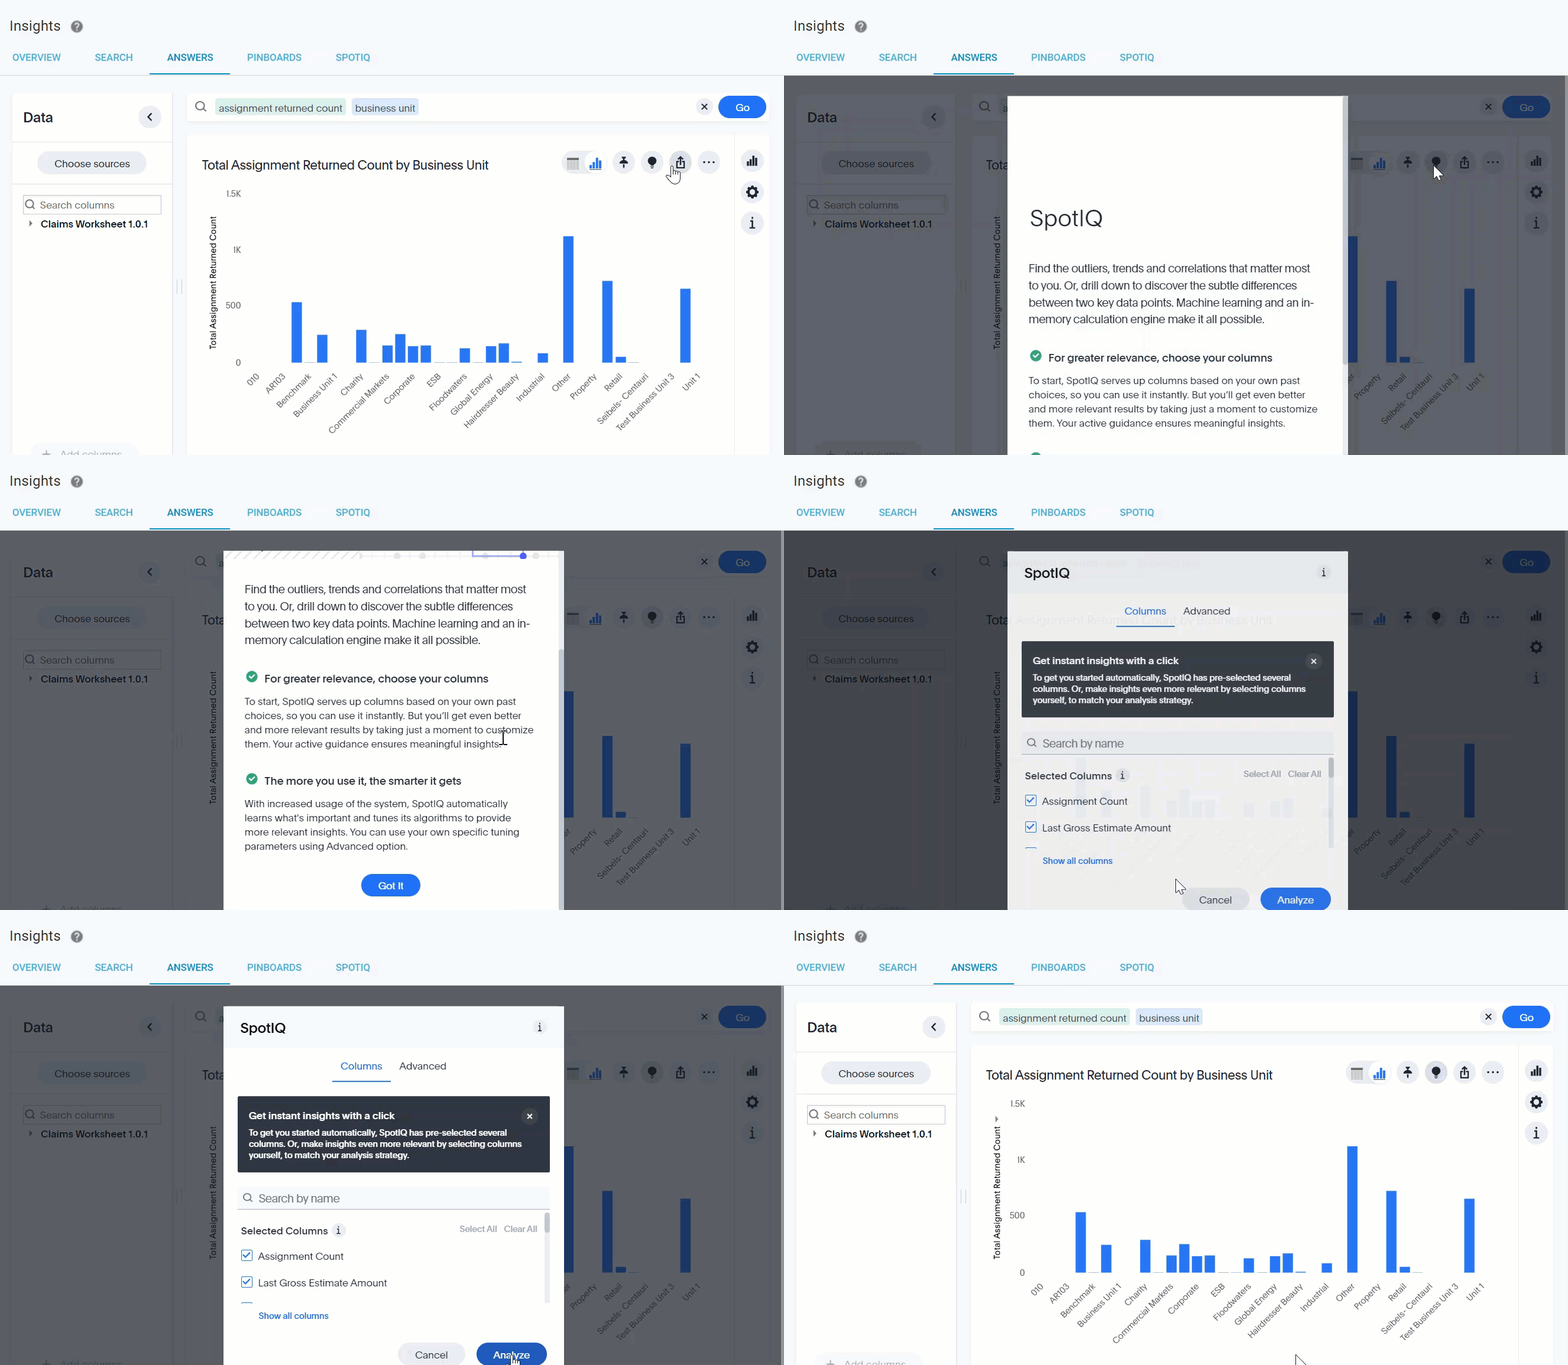
- From an answer, click the SpotIQ icon
 .
. - When the SpotIQ explanation window appears, click Got It.
- Select the columns you want to analyze.
- Click Analyze. You will receive an email when your SpotIQ results are ready.
View SpotIQ results
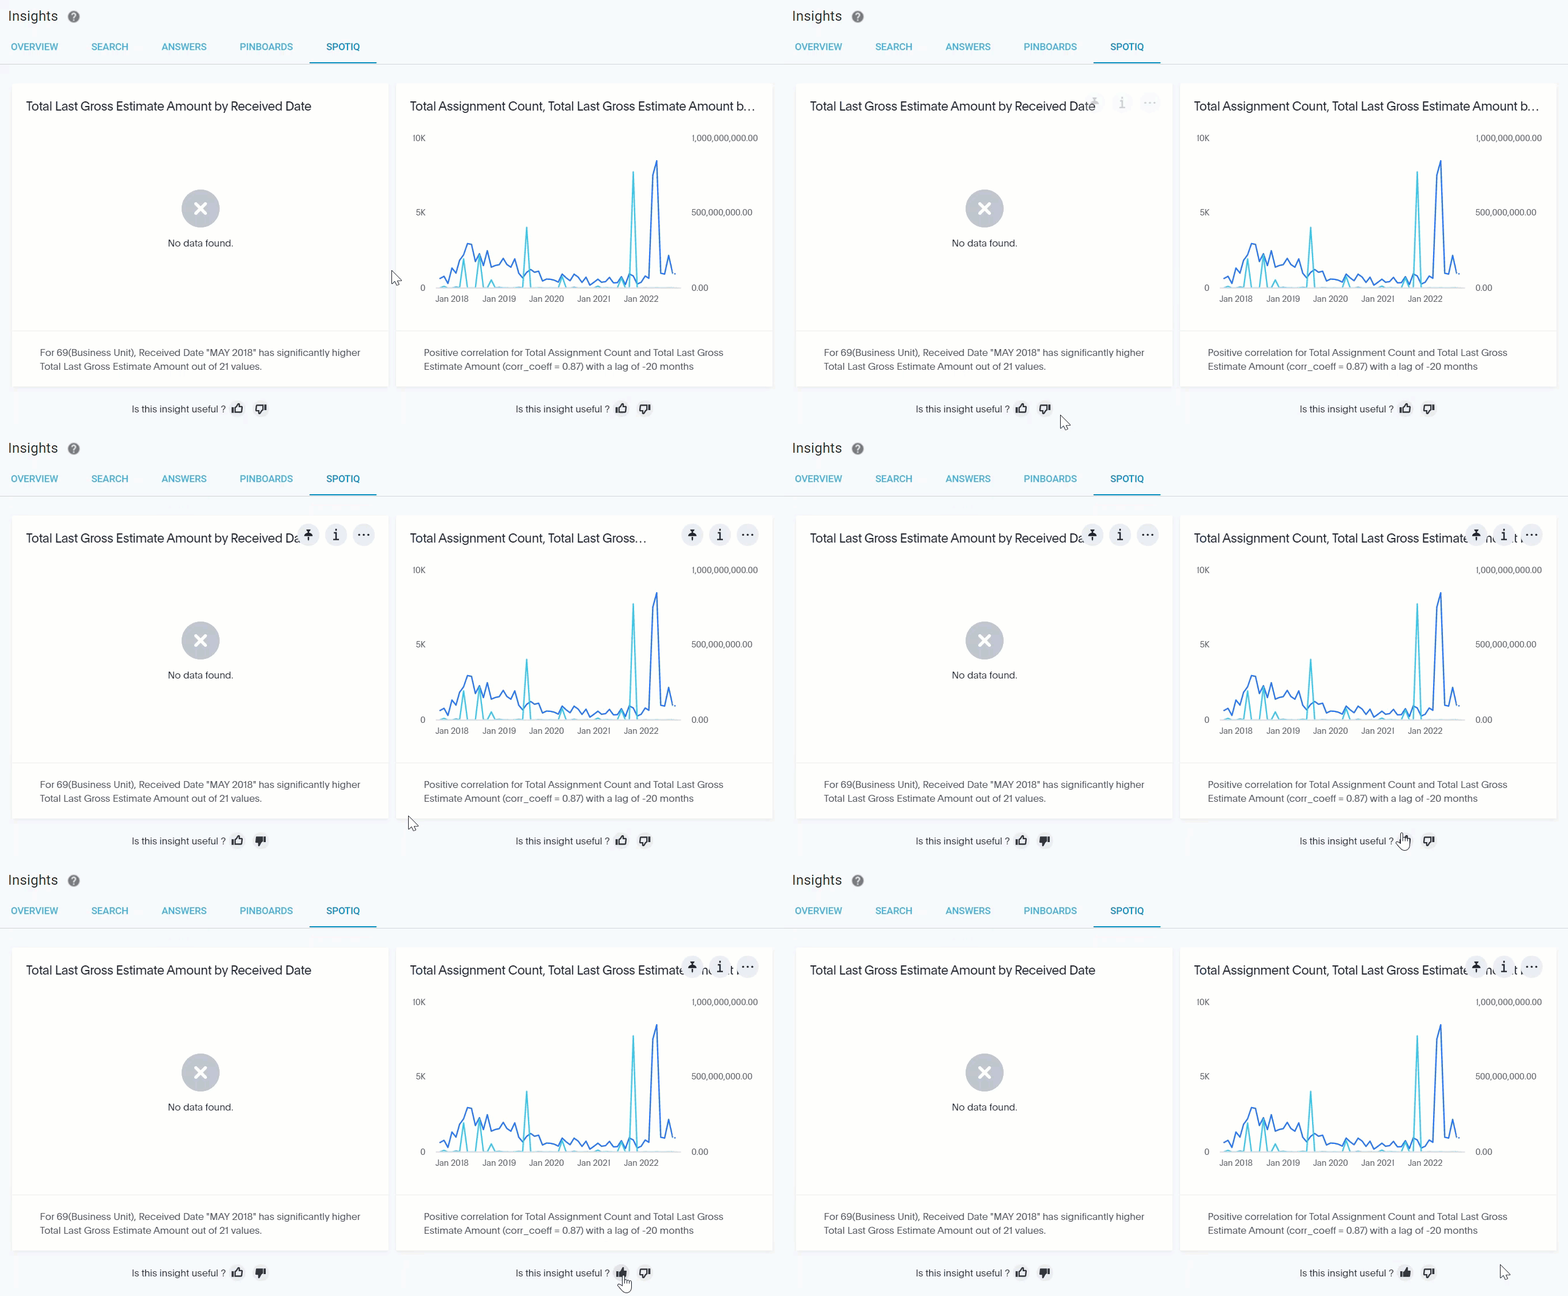
When you receive an email that the SpotIQ analysis is done, either click the link or find the results under the SpotIQ tab in Insights.

Submit Feedback to SpotIQ
You might not find all SpotIQ findings useful. However, giving a thumbs up or thumbs down for each visualization helps SpotIQ return better results in the future.

