A.M. Best Industry Ranking in Management Reports
 Updated
by
Arianne G.
Updated
by
Arianne G.
The A.M. Best Industry Ranking feature in Management/Activity Reports helps you compare your company to your peers (U.S. insurance carriers) based on data provided by A.M. Best. Please note that reports using the A.M. Best Industry Ranking feature include data only for companies that use XactAnalysis®.
Three A.M. Best industry ranking options, Group Rank w/out [your company], Top 10 w/out [your company], and Top 25 w/out [your company], are available for the following management reports:
- Estimate Depreciation Usage
- Estimate Flooring Usage
- Estimate Inclusion Issues
- Estimate Items by Quality
- Estimate Minimum/Base Service Charge Usage
- Estimate Overhead and Profit
- Estimate Overhead and Profit Usage
- Estimate Roofing Usage
- Estimate Scoping Overlap
- Estimate Siding Usage
- Estimate Tax Usage
- Estimate Type of Loss
- Estimate/Price List Differences
- Estimate/Price List Differences for Contents
- Labor Efficiency Usage
- Percentage Breakdown of Estimate by Department
- Percentage Breakdown of Estimate by Trade
- Percentage Deviation of Estimate by Trade
- Estimate Trending for Contents
- Contents Cost Comparison
- Estimate Audit Results
- Estimate Breakdown by Department
- Estimate Breakdown by Type
- Estimate Cycle Time
- Initial Response Time
- Loss Value Range
- Price Deviations
- Response Time
- Sub Limits
- Type of Loss
- Value Range
To use these options, go to Management/Activity Reports and select a report from the list above. The A.M. Best options will appear as the last three options in the Industry category. When you select an industry, the Ranking check box below it becomes available.
Group Rank w/out [your company]
Compare your company’s data to the average data of up to your six closest and no less than your three closest peers in the A.M. Best ranking.
How is this calculated?
The report you select is run based on the averages of up to your six closest peers and at a minimum, your three closest. To find your closest peers, the tool uses an algorithm to look for three companies just above and three companies just below yours in the A.M. Best ranking. To ensure accurate comparisons, a company is selected only if it shares 80% or more of your company’s coverage areas (i.e. zip codes). If the algorithm cannot find at least three companies that fit this criterion within 20 rankings (10 above and 10 below) of your company, group ranking data does not appear in the completed report.
What will I see?
If you select the Ranking check box, the generated report will contain a new column, A.M. Best Group Ranking*. This column displays where your data set ranks against up to your six closest peers in the A.M. Best ranking.
A new report, Group Ranking w/out [your company], appears (below or next to the original report), which is based on the averages of up to your six closest peers.
Top 10 w/out [your company]
Compare your company’s data to the average data of the top 10 companies in the A.M. Best ranking.
How is this calculated?
The report you select is run based on the averages of the top 10 companies in the A.M. Best ranking. If your company is in the top 10, it is left out of the report average so you can see how your company compares to the rest of the top 10 companies.
What will I see?
If you select the Ranking check box, the generated report will contain a new column, A.M. Best Top 10 Ranking*. This column displays where your data set ranks against the top 10 companies in the A.M. Best Ranking.
A new report, Top 10 w/out [your company], appears (below or next to the original report), which is based on the averages of the top 10 companies in the A.M. Best ranking.
Top 25 w/out [your company]
Compare your company’s data to the average data of the top 25 companies in the A.M. Best ranking.
How is this calculated?
The report you select is run based on the average data of the top 25 companies in the A.M. Best ranking. If your company is in the top 25, it is left out of the report average so you can see how your company compares to the rest of the top 25 companies.
What will I see?
If you select the Ranking check box, the generated report will contain a new column, A.M. Best Top 25 Ranking*. This column displays where your data set ranks against the top 25 companies in the A.M. Best ranking.
A new report, Top 25 w/out [your company], appears (below or next to the original report), which is based on the averages of the top 25 companies in the A.M. Best Ranking.
Ranking
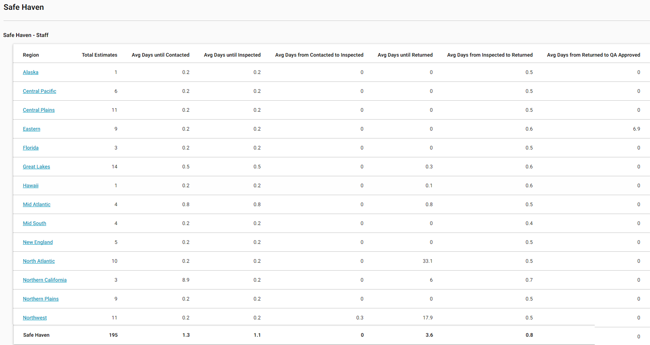
If you select one or more Ranking check boxes, the generated report contains a new column for each industry ranking. The Notes section at the bottom of the report explains how the ranking columns are calculated.
For example, in the Initial Response Time report, the ranking columns are based on Average Days Returned*. If the A.M. Best Top 10 Ranking column total is 12%, then your company is in the 12th percentile compared to the average of the Top 10 companies (i.e., 12% of the Top 10 companies had average return values greater (took longer) than your company’s average return value and 88% of Top 10 companies had average return values less than or equal to your company's average).