Management and Activity Reports
Management/Activity reports allow you to monitor the work performed by your adjusters, contractors, and employees, the flow of estimates in specific regions and data sets, and trends in materials usage and cost. You can even compare your organization’s data to industry competitors with a number of reports. This information can help you spot bottlenecks in your organization’s workflow, anomalies in estimate data, and company trends alongside industry trends, allowing you to better manage the work performed within your organization.
The screenshots in this document are generic, and your company’s interface may vary slightly.
Select the following report types to view descriptions of individual reports:
Related: FAQ > Report questions, Custom Groups, Organization Hierarchy, A.M. Best Ranking, Hierarchy, Assignment Volume Report
Access Management/Activity Reports
- Select Management/Activity Reports from the Reports menu.
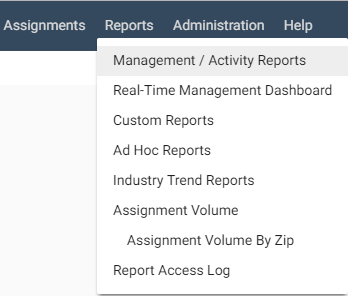
The Management/Activity Reports page appears.
Generate reports
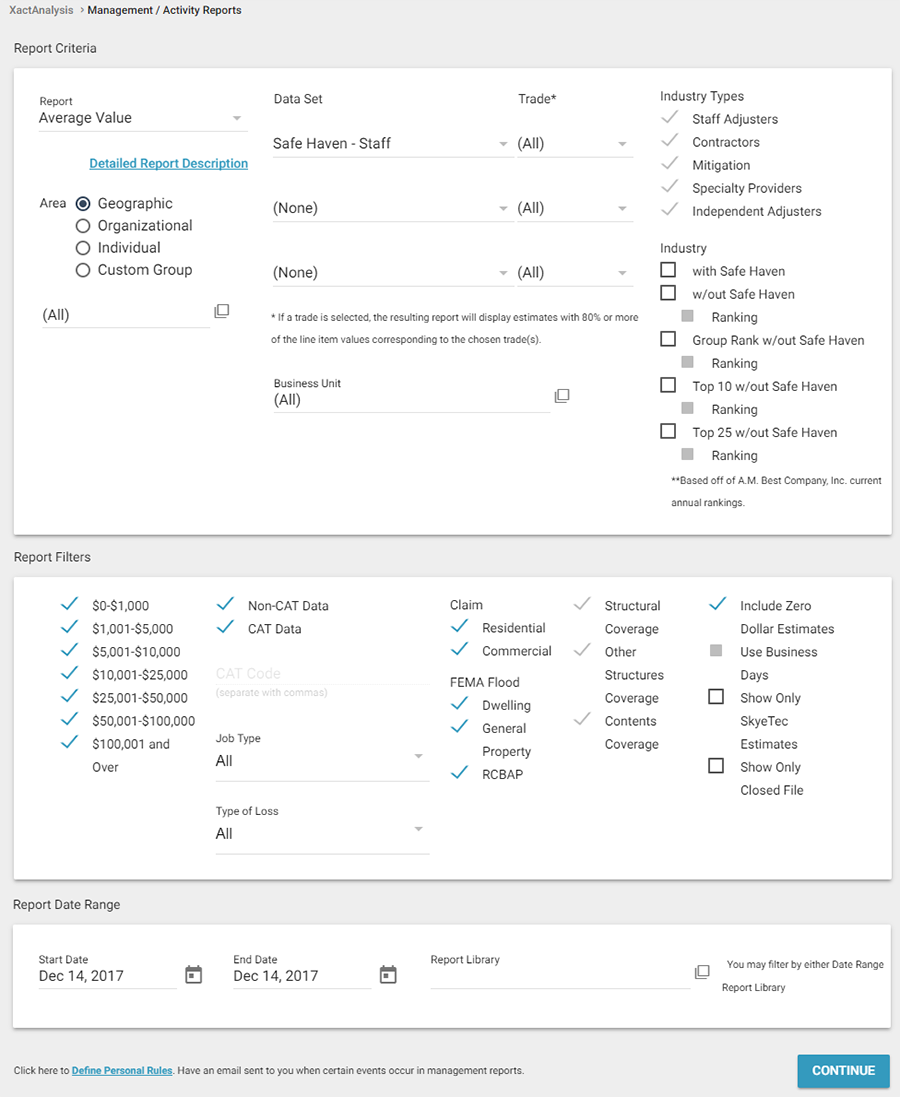
- Select a report from the Report menu.
- Use the menus, fields, and checkboxes in the Report Criteria and Report Filters sections to filter the data you want displayed in the report. See Additional Report Criteria and Filters for information about each menu, field, and checkbox.
- Click the Start Date and End Date SmartCalendar buttons to choose the start and end dates for the report.
- Click Continue. A few reports show only current information and will automatically gray out these fields.
- The Confirmation page appears. Make sure the email address in the address field is correct, and click Submit. If you do not enter an email address, the report will still be generated, but you will not be notified. You can find the report in the Report Library once it has been generated.
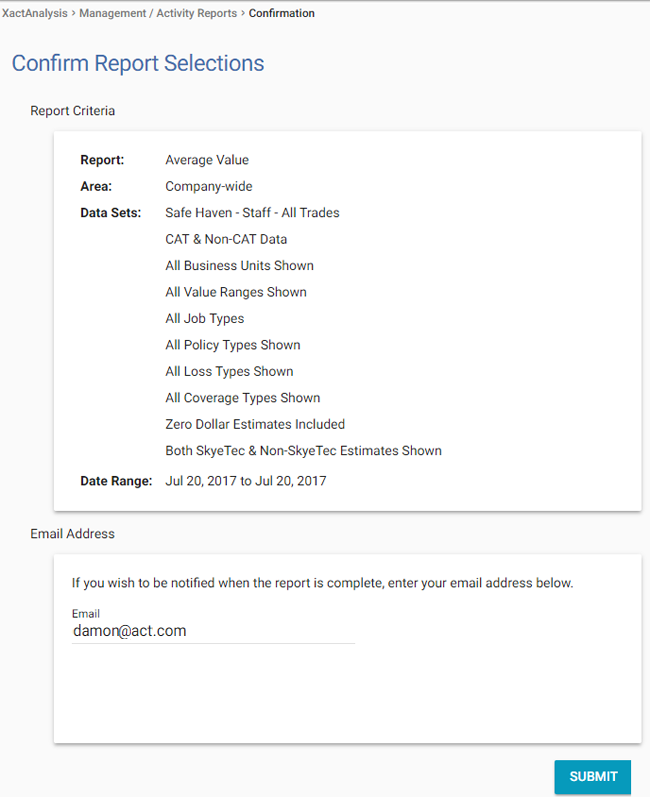
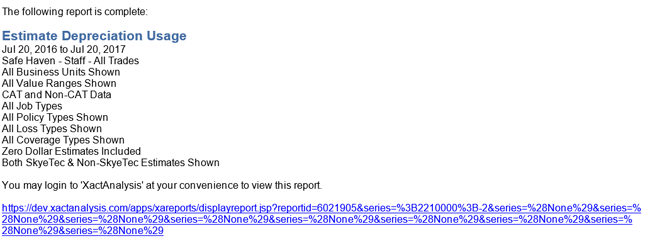
- If you entered an email address, you will receive an email with a link to the report. Select this link to see the report.
View reports
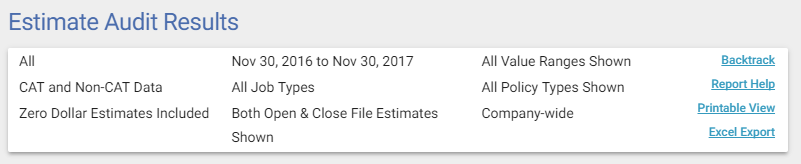
Report header
When viewing a report (excluding Excel reports), you’ll see a report header above the report. This header displays your report filter selections and a number of links.
- The Backtrack link is available if you’ve navigated to a different hierarchy level in the report. When you click this link, the previously viewed hierarchy level appears.
- When you click Printable View, a printable view of the report appears.
- When you click Excel Export, the current view of the report data is exported to an Excel worksheet.
- When you click Report Help, the Management / Activity Reports help index page appears.
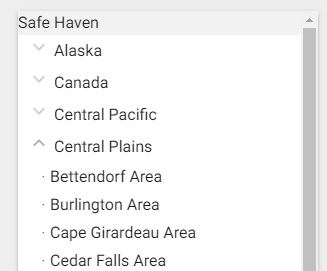
Hierarchy tree
A hierarchy tree appears to the left of each report (excluding Excel reports), dependent on your organization’s hierarchy, your security rights, and the report criteria.
- Select the arrow to the left of a level label to expand the tree and see lower levels of the hierarchy.
- When you select a specific level (not a plus or minus sign, but the label), the report changes to show data for that level only.
The image below shows a hierarchy tree for a company that uses Geographic Hierarchy. Your company may use Organizational Hierarchy, in which case the hierarchy tree would show office levels rather than geographic areas.
You can also select table row labels, graph bars in graphical reports, and plot points in trend reports to view data for other levels of your hierarchy, data for table categories split into hierarchy groups, or data for a specific period of time. With most reports, you can navigate to see information for individual estimates by using these links.
Additional Report Criteria and Filters
The Management/Activity Reports menus, fields, and checkboxes are defined below.
Report Criteria
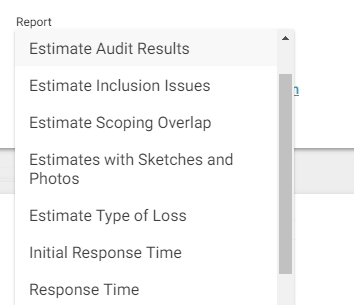
Report
- Select the report you want to create.
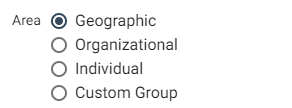
Area
- Choose a hierarchy type by selecting one of the radio buttons (Geographic, Organizational, Individual, Custom Group).
- Click the Area SmartList button to choose the level of hierarchy you want shown in the report.
- In the dialog box that appears, you can select lower levels of your hierarchy by first clicking the names of the higher hierarchy levels. Only estimates in the selected hierarchy groups/levels will appear in the report.
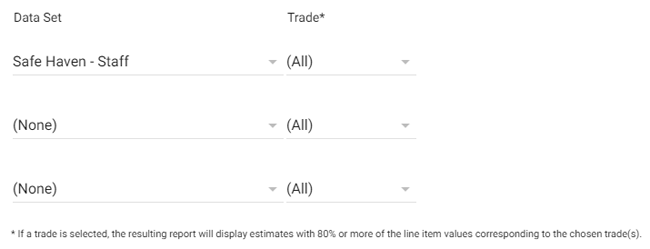
Data Set / Trade
Use these dropdown menus to create up to three series (for example, combinations of a data set and trade) to appear in the report. Only data for estimates that fit the criteria of the chosen series will appear in the report. Data sets and trades are available based on your rights and company settings.
- Compare specific data sets within your company to specific data sets in the industry at large using the Data Set and Trade menus, the Industry Type check boxes, and the Industry check boxes together. See Industry / Industry Types (below) for more information.
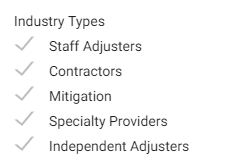
Industry / Industry Types
The Industry Types and Industry checkboxes work together (with the Data Set and Trade menus).
To compare one of your company’s data sets with similar data sets in the industry, select the similar data sets from the Industry Types checkboxes (or clear the dissimilar data set checkboxes). This narrows the results of the industry comparison. For example, if you choose to compare your company’s Staff data set (see image above) to the industry, you can narrow the comparison by selecting the "Staff Adjuster" Industry Type and deselecting the others (see image below). This ensures that your company’s Staff data set will only be compared to the industry’s Staff Adjusters data sets in the report.
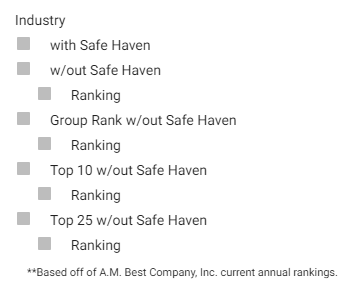
After you narrow down the industry types, select one or more checkboxes in the Industry section. The industry data appearing alongside your company data in the report will reflect this selection.
If you select w/out [your company], the Ranking check box appears. When Ranking is selected, the generated report contains a new column. This column displays how your data set ranks against the industry data. The asterisks* in the report and notes at the bottom of the report show which columns are included in the ranking. See more information about industry ranking here.
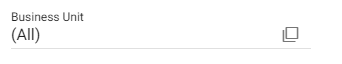
Business Unit
- Click the Business Unit SmartList button to select a business unit(s). Only estimates with the selected business unit(s) will appear in the report.
Report Filters
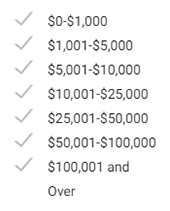
Loss Size
- Clear the loss size checkboxes to exclude data for estimates with those loss sizes from the report.
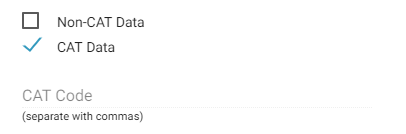
CAT Data
- Clear the Non-CAT Data check box if you want to see information for estimates with CAT data only and vice versa. If only the CAT Data check box is selected, you can type one or more CAT codes in the field below the check box to see data for only those CAT codes.
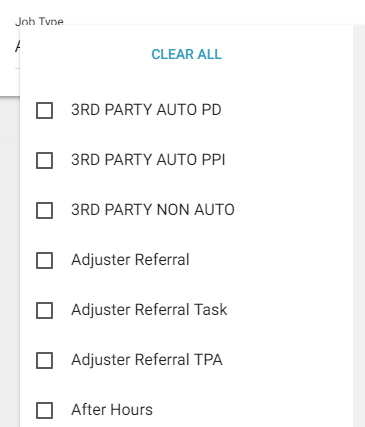
Job Type
- Select one or more job types to see only estimates with the selected job types in the report.
- Select the types of loss you want to include in your report. If none are selected, estimates with all types of loss will be included in the report.
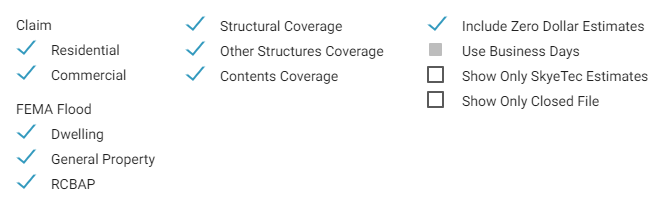
Policy Type filters
- Clear the checkboxes for Residential, Commercial, or a FEMA Flood type to exclude these types of estimates from the report.
Coverage filters
- Clear the checkboxes for Structural Coverage, Other Structures Coverage, or Contents Coverage to exclude estimates with structural or contents items from the report. The coverage filters are only available for reports that show coverage items.
- Structural Items are items comprising the structure of the main building, such as flooring or masonry products.
- Other Structures refers to estimates with items comprising the structure of a secondary building.
- Contents Items are independent of the property’s structure and can include items like appliances and furniture.
Other report filters
- Clear the Include Zero Dollar Estimates check box to exclude zero dollar estimates from the report.
- Select the Use Business Days check box to show data for business days instead of all days in Response Time reports and the Cycle Time report.
- Select the Show Only Closed File check box to include only estimates marked as File Closed in the report.
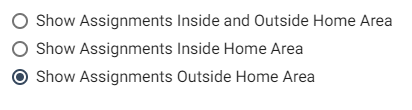
Home Area
- Leave the Show Assignments Inside and Outside Home Area radio button selected if you want to see data for all assignments (that fit the other criteria of the report).
- Select the Show Assignments Inside Home Area radio button to see only home area assignment data.
- Select the Show Assignments Outside Home Area radio button to exclude home area assignment data from the report.