Performance Scorecard Thresholds

Performance Scorecard Threshold lets you manage the thresholds that grade conditions for each metric, category, and overall score. In Performance Scorecard, each metric and category has a set of score ranges for the green, yellow, and red colors (or grades) used in the scorecards. These score ranges are thresholds.
The screenshots in this document are generic, and your company’s interface may vary.
Grant Performance Scorecard Threshold rights
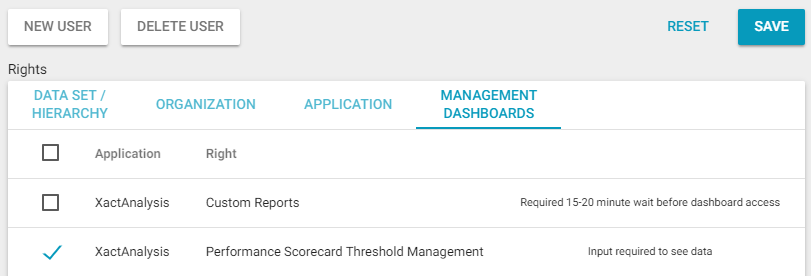
To access Performance Scorecard Thresholds, users must first have the Performance Scorecard Threshold Management right. When you edit the user's information, you can find this right in the Management Dashboards tab. For more information, see User Administration.
Access Performance Scorecard Thresholds
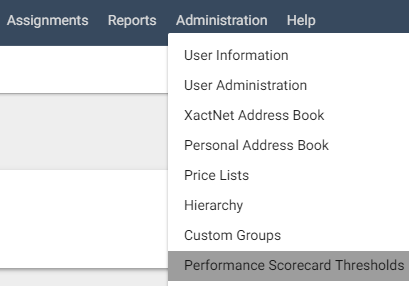
Select Performance Scorecard Thresholds from the Administration menu.
Threshold Components
Metric Categories
The groups of metrics that determine the Overall Category score: Cycle Time, Price List Changes, Estimate Quality, and Reinspection.
Metrics
The measurable attributes by which success or failure can be assessed.
Pass
The score at or above which is deemed acceptable (0-100).
Fail
The score below which is deemed unacceptable (0-100).
Weight
A numerical value representing the weight or importance of the metric when calculating the overall category score.
% Weight
The percentage the metric's weight is to the overall weight. For example, if the metric's weight is 8 and the overall weight (all weights added up) is 42, the % weight is 19.
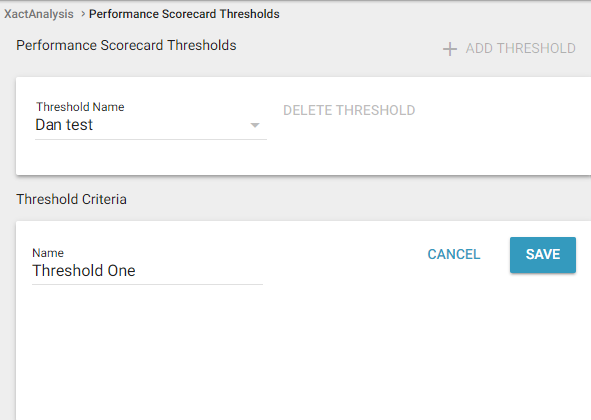
Add a Threshold
Click Add Threshold.
Enter a name for the threshold in the Name field.
Click Save.
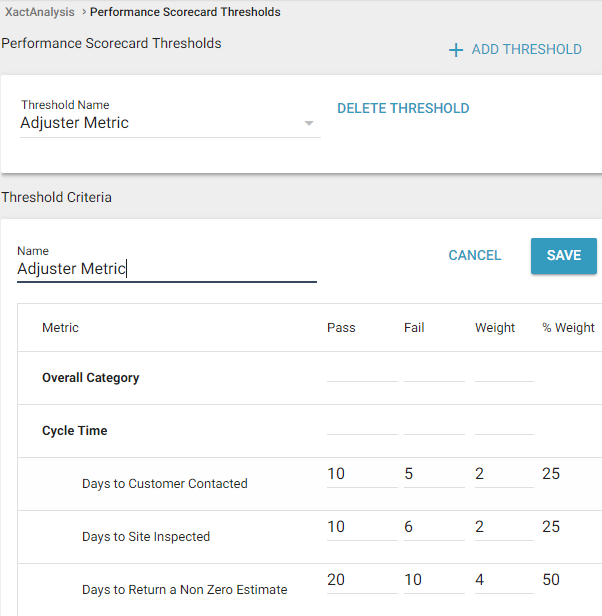
Enter threshold values for the Pass, Fail, and Weight fields for each metric. For detailed information about each metric, see the Metric Definitions section below.
Click Save.
Edit a Threshold
- Select a threshold from the Threshold Name menu.
- Edit the threshold's name in the Name field if necessary.
- Modify the threshold's Pass, Fail, and Weight scores as necessary.
- Click Save.
Delete a Threshold
- Select a threshold from the Threshold Name menu.
- Click Delete Threshold.
- Click Yes.
Metric Definitions
The metrics that contribute to each category score are listed below.
Cycle Time metrics
Adjuster or contractor performance in the following metrics, as well as metric weight, determines the Cycle Time score.
Days in Queue to QA Approved
The number of days between the time an assignment enters the queue and the time it is updated as “QA Approved”.
Days to Customer Contact
The number of days between the time an assignment is created and the time it is updated as “Customer Contacted”.
Days to Site Inspected
The number of days between the time an assignment is created and the time it is updated as “Site Inspected”.
Days Site Inspected to Estimate Returned
The number of days between the time an assignment is updated as “Site Inspected” and the time the assignment is returned to XactAnalysis.
Days Estimate Returned to Job Start
The number of days between the time an assignment is returned to XactAnalysis and the time it is updated as “Job Started”.
Days to QA Approved
The number of days between the time an assignment is created and the time it is updated as “QA Approved”.
Cycle Time metrics are left blank and are not included in the calculation of the category score if:
- There is no Begin date
- There is no End date
- The End date is before the Begin date
- The End date is 100 days or more after the Begin date
The metric receives a score of zero and is included in the calculation of the category score if the Begin date and End date are the same and the end date has no time component.
Estimate Quality metrics
Adjuster or contractor performance in the following metrics, as well as metric weight, determines the Estimate Quality score.
Claims with Estimate Corrections
The percent of estimates with corrections made to them.
Percent Estimates with Results
The percent of estimates changed before upload (after Xactimate inspection).
Estimates with Overhead and Profit
The percent of estimates with overhead or profit applied to them.
Estimates with Depreciation
The percent of estimates with depreciation applied to them.
Estimates with Inspection Findings
The percent of estimates with inspection findings (broken rules).
Price List Changes metrics
Adjuster or contractor performance in the following metrics, as well as metric weight, determines the Price List Changes score.
Estimate Deviation Percent
The Percent difference between pricelist amount and the estimate amount.
Line Items with Any Changes
The average number of items per estimate with any price list variation (meaning at least one of the following changes occurred: price, description, or unit).
Line Items with Price Changes
The average number of items per estimate with a price change.
Line Items with Unit Changes
The average number of items per estimate with a unit change.
Percent Estimates with Price Deviation
The percent of estimates with a price deviation.
Reinspection metrics
Adjuster or contractor performance in the following metrics, as well as metric weight, determines the Reinspection score. Metrics that involve dates use the date of the most recent form.
Deviation Percent
The percent deviation from the estimate and the reinspection.
Effective Reinspection
The percent of estimates with an effective reinspection form.
Reinspection Overwrites
The average number of overwrites per reinspection.
Reinspection Underwrites
The average number of underwrites per reinspection.
Form Score
The percent of reinspections with form scores.
Reinspection Response
The average reinspection response time in days.