Real-Time Management Dashboard

The Real-Time Management Dashboard allows you to view an overview of your company’s current claims and performance data. You can filter the dashboard as necessary and you can interact with the unique features available in each tab.
Access Real-Time Management Dashboard
Select Real-Time Management Dashboard from the Reports menu.
Filters
You can filter the entire dashboard with any of the fields located at the top of the screen.
Data Set
Filter the entire dashboard by information from a specific data set.
Area
Filter the entire dashboard by your company's Hierarchy areas.
Date Range
Filter the entire dashboard by a specified date range.
Type of Loss
Filter the entire dashboard by incident types, like Theft or Fire, which necessitate a claim.
Zip/Postal Code
Filter the entire dashboard by a specified Zip Code. When the Plot Points check box is selected, dots representing individual claims appear on the Claim Trends map.
CAT
This filter allows you to specify whether you want to view only catastrophe claims, non-catastrophe claims, or all claims.
Data Type (Left)
This filter only appears when the Performance tab is selected. It allows you to select which data is used in the left graph.
Data Type (Right)
This filter only appears when the Performance tab is selected. It allows you to select which data is used in the right graph.
Show
This filter only appears when the Performance tab is selected. It allows you to select how the data in the two graphs are organized. You can view the information according to region, program location, or contractor.
Highest/Lowest Values
This filter only appears when the Performance tab is selected. It allows you to select whether the data is organized highest to lowest or lowest to highest.
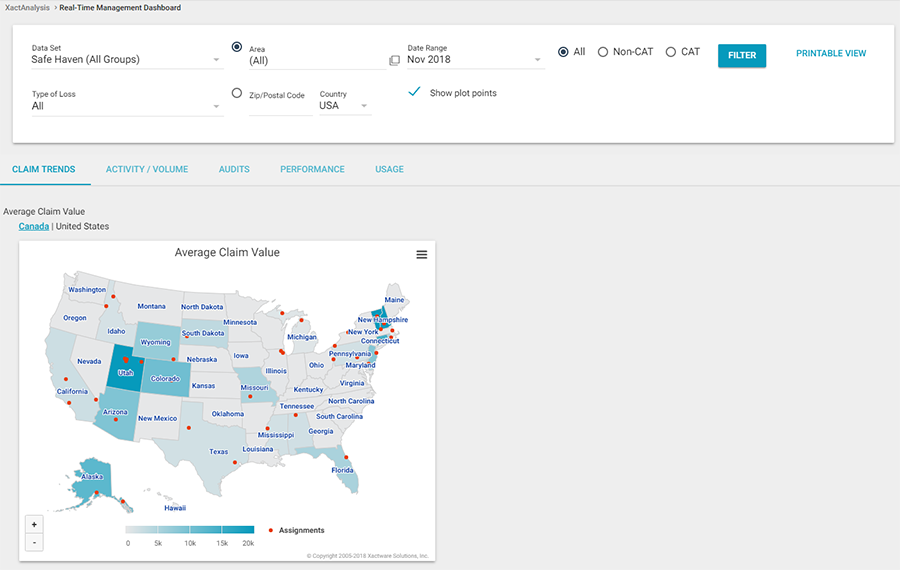
Claim Trends tab
This tab displays the average claim value by country (United States or Canada). You can click on any of the states, counties, or Zip codes in the map to drill down to that level. When you reach the Zip code level, you can then drill down to individual claims.
- You can print or download the map in its current state by clicking the icon in the top-right corner of the map and selecting the appropriate option.
Activity/Volume tab
This tab displays a graph displaying claim response times (measured in days) compared to industry-wide response times. The Average Response Times table displays the average elapsed time between an assignment's Received status and its Customer Contacted, Onsite Inspected, and Estimate Uploaded statuses. The time is displayed in days compared to industry response times.
- You can hide or reveal items in the graph by clicking the item in the legend.
- You can print or download the graph in its current state by clicking the icon in the top-right corner of the graph and selecting the appropriate option.
Audits tab
This tab displays an audit summary and a graph showing total estimates by area. Total estimates are displayed by default, and you can select the radio button of the criteria you want to display.
- You can print or download the graph in its current state by clicking the icon in the top-right corner of the graph and selecting the appropriate option.
Performance tab
This tab allows you to compare data types with two graphs side by side. You can select the data types for each graph from the Data Type filters. You can also organize the data in both graphs by region, program location, or by individual contractors with the Show filter.
- You can hide or reveal items in either of the graphs by clicking the items in their legends.
- You can print or download a graph in its current state by clicking the icon in the top-right corner of the graph and selecting the appropriate option.
Usage tab
This tab displays the total number of users and inactive accounts in a selected data set over the past 12 months. It also displays the data set’s most used reports and program rules. You can click a report name or program rule to view its data in the Details sections. You can click the menu in the Most Used Reports section to filter reports by management, industry, or activity.