Text Management Reports
 Updated
by
Arianne G.
Updated
by
Arianne G.
- Average Value
- Contents Cost Comparison
- Contents Recap by Age
- Adjuster/Contractor Utilization
- Discounted Items
- Estimate Audit Results
- Estimate Breakdown by Department
- Estimate Breakdown by NFCP Reason
- Estimate Breakdown by Trade
- Estimate Breakdown by Type
- Estimate Depreciation Usage Line Item
- Estimates with Sketches and Photos
- Frequently Used Items
- Hazardous Materials
- Initial Response Time
- Initial Response Time Multiple Owners
- Items Changed by Adjuster/Contractor
- Loss Value Range
- Miscellaneous Items
- Payment Tracker
- Price Deviations
- Response Time
- Sub Limits
- Supplement
- Supplements and Corrections by Reason
- Timely Estimate Variance
- Total Claims Volume
- Type of Loss
- Value Range
- ZIP Codes
The following Text management reports are available in XactAnalysis®, depending on your company’s settings and your rights. See Management/Activity Reports for help with generating reports.
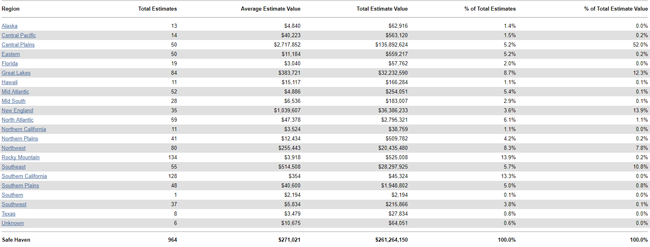
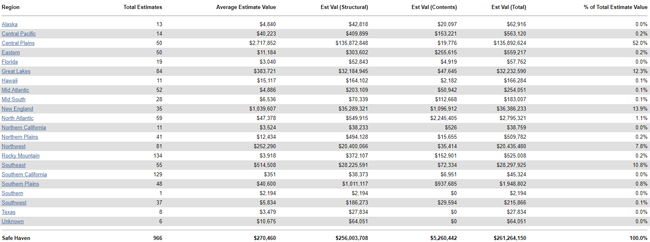
Average Value
This report displays the number of estimates in each region / office level, their value, and their average value. This information helps you see geographic/organizational trends in estimate value.
- Select a geographic/organizational area link to see data for other levels of your hierarchy, including individual estimates.
Columns
Region / Office Level: Geographic/organizational area
Total Estimates: Number of estimates
Average Estimate Value: Average value per estimate (Total Estimate Value / Total Estimates)
Total Estimate Value: Total estimate value
% of Total Estimates: Percentage of total estimates
% of Total Estimate Value: Percentage of total estimate value
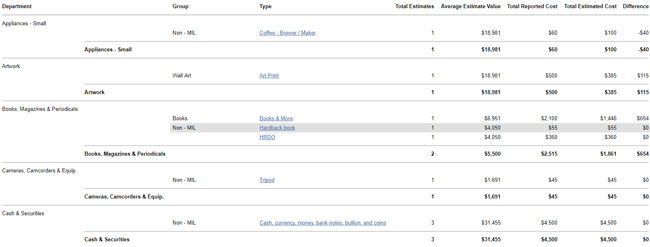
Contents Cost Comparison
This report compares contents costs (as reported by the insured) to replacement costs (as reported in the estimate by the adjuster or contractor). This information helps you arrive at fair prices for each claim.
- Select a contents type to see data for other levels of your hierarchy, including individual estimates.
Columns
Department: Contents department
Group: Contents group
Type: Contents type
Total Estimates: Number of estimates
Average Estimate Value: Average value per estimate
Total Reported cost: Cost of the contents items as reported by the insured
Total Estimated Cost: Cost of the contents items as estimated by the adjuster or contractor
Difference: The difference between the reported cost and the estimated cost (Total Reported Cost - Total Estimated Cost)
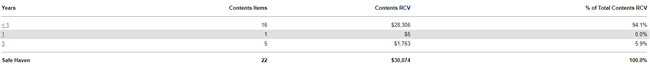
Contents Recap by Age
This report displays contents items data by age, as reported by the insured.
- Select a Years link to see data for other levels of your hierarchy, including individual estimates.
Columns
Years: Contents items age
Contents Items: Number of contents items
Contents RCV: Replacement cost value of contents items. Replacement cost value is the value of contents items without deduction for depreciation.
% of Total Contents RCV: Percentage of total contents replacement cost value
Adjuster/Contractor Utilization
This report displays contents and structural estimate information by adjuster or contractor.
- Select a geographic/organizational area link to see data for other levels of your hierarchy, including individual estimates.
Columns
Region / Office Level: Geographic/organizational area
Total Estimates: Number of estimates
Average Estimate Value: Average value per estimate (Total Estimate Value / Total Estimates)
Total Estimate Value: Total value of estimates
% of Total Estimates: Percentage of total estimates
% of Total Estimate Value: Percentage of total estimate value
Rows
Contents: Contents items in Xactimate®
Structural: Structural items in Xactimate
Discounted Items
This report shows the discounts received from service providers by region.
- Select a geographic/organizational area link to see data for other levels of a hierarchy, including individual estimates.
Columns
Region / Office Level: Geographic/organizational area
Total Estimates: Number of estimates
Total Estimate Value: Total value of estimates
Total Discounted Amount: Total value of discounts from service providers
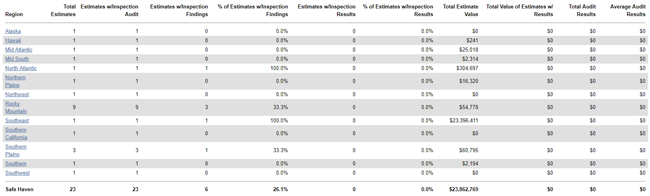
Estimate Audit Results
This report displays the audit results derived from estimate audits/inspections, helping you see the effectiveness of audits/inspections.
- Select a geographic/organizational area link to see data for other levels of your hierarchy, including individual estimates.
Columns
Region / Office Level: Geographic/organizational area
Total Estimates: Number of estimates
Estimates w/Inspection Audit: Number of estimates with audits/inspections performed
Estimates w/Inspection Findings: Number of estimates with errors found during audits/inspections
% of Estimates w/Inspection Findings: Percentage of estimates with errors found during audits/inspections
Estimates w/Inspection Results: Number of estimates with corrections made
% of Estimates w/Inspection Results: Percentage of estimates with errors found and corrections made
Total Estimate Value: Total estimate value
Total Value of Estimates w/Results: Total value of original estimates with errors found and corrections made
Total Audit Results: Total value of line items with errors found and corrections made
Average Audit Results: Average value per estimate of line items with errors found and corrections made (Total Audit Results / Estimates w/Inspection Results)
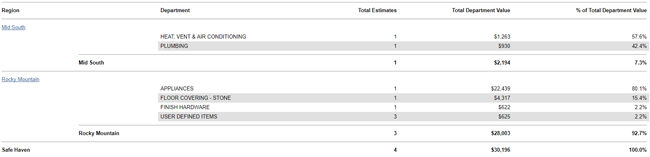
Estimate Breakdown by Department
This report displays the percentage each contents department (Appliances, Cabinetry, etc.) contributes to the total estimate value, helping you see which contents items are most and least used.
- Select a geographic/organizational area link to see data for other levels of your hierarchy, including individual estimates.
Columns
Region / Office Level: Geographic/organizational area
Department: Contents department used for each line item
Total Estimates: Number of estimates
Total Department Value: Value of the estimate line items
% of Total Department Value: Percentage of total department value
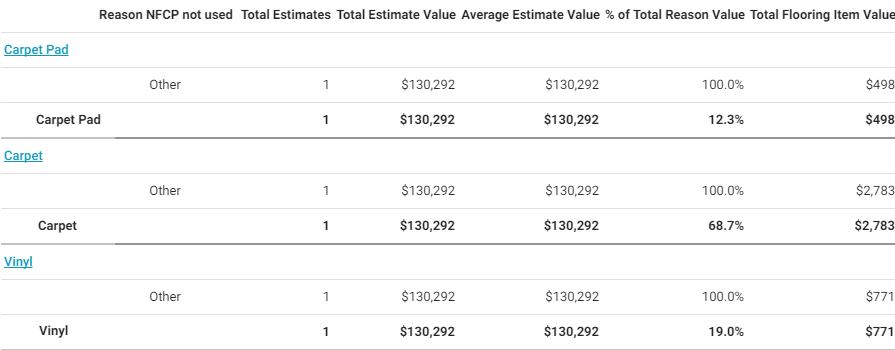
Estimate Breakdown by NFCP Reason
This report displays estimate information by flooring item, including reasons NFCP was not used. When an estimate uses NFCP, samples of flooring are sent to a third-party vendor who sends back information about the flooring’s make and grade so the adjuster or contractor can install an exact match or arrive at an exact price. This report helps you track the reasons NFCP was not used.
Columns
Reason NFCP not used: Reason NFCP was not used
Total Estimates: Number of estimates
Total Estimate Value: Total value of estimates
Average Estimate Value: Average estimate value (Total Estimate Value / Total Estimates)
% of Total Reason Value: Percentage of the total flooring item value by reason
Total Flooring Item Value: Total value of flooring items
Rows
Flooring items
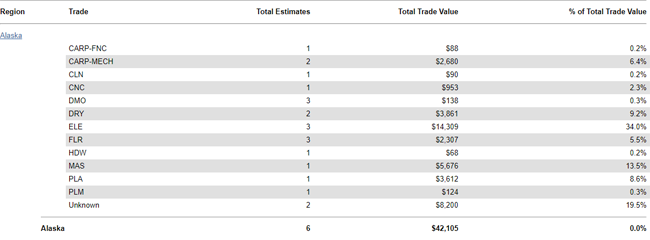
Estimate Breakdown by Trade
This report displays each trade’s percentage of estimates’ total trade value (excluding O&P and tax). This helps you evaluate trade usage and value in your hierarchy.
- Select a geographic/organizational area link to see data for other levels of your hierarchy, including individual estimates.
Columns
Region / Office Level: Geographic/organizational area
Trade: Trade
Total Estimates: Number of estimates
Total Trade Value: Total value of line items
% of Total Trade Value: Percentage of total trade value
Trades
In reports dealing with trades, the trade names are abbreviated. The following is a list of abbreviated trade names and their meanings (taken from the Labor Component SmartList in Xactimate):
CARP-FNC: Carpenter—Finish, Trim/Cabinet
CARP-FRM: Carpenter—General Framer
CARP-MECH: Carpenter—Mechanic
CLN: Cleaning Technician
CLN-F: Floor Cleaning Technician
CLN-R: Cleaning Remediation Technician
CLN-S: Cleaning – Supervisory/Administrative
CNC: Concrete Mason
DMO: Demolition Laborer
DRY: Drywall Installer/Finisher
ELE: Electrician
EQU: Equipment Operator
FEN: Fencing Installer
FLR: Flooring Installer
FLR-W: Wood Flooring Installer
HDW: Hardware Installer
HMRT: Hazardous Materials Remediation Technician
HVC: Heating / A.C. Mechanic
INS: Insulation Installer
LBR: General Laborer
MAS: Mason Brick/Stone
OHD: Overhead Door Installer
ORI: Ornamental Iron Installer
PLA: Plasterer
PLM: Plumber
PNT: Painter
RFG: Roofer
RFG-M: Membrane Roofing Installer
SDG: Siding Installer
STL: Steel Worker
STU: Stucco Installer
SUPERC: Commercial Superintendent
SUPERR: Residential Superintendent
SUB: Non Labor item
TIL: Tile/Cultured Marble Installer
TRT: Trauma/Crime Scene Cleaning Technician
WPR: Wallpaper Hanger
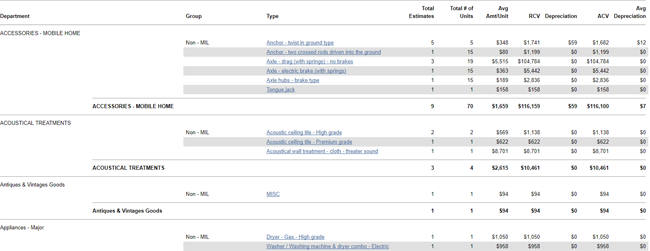
Estimate Breakdown by Type
This report displays estimate information by contents department, group, and type. This helps you track which contents items are most and least used.
- Select a Type to see data for other levels of your hierarchy, including individual estimates.
Columns
Department: Department category from Xactimate SmartList
Group: Group from Xactimate SmartList (Items not in the price list are Non-MIL)
Type: Type of item from Xactimate SmartList
Total Estimates: Number of estimates
Total # Units: Number of units (items)
Avg Amt/Unit: Average dollar amount per unit (RCV / Total # Units)
RCV: Replacement cost value
Depreciation: Value lost due to wear and tear
ACV: Actual cash value (RCV - Depreciation)
Average Depreciation: Average value lost due to wear and tear per estimate (Depreciation / Total Estimates)
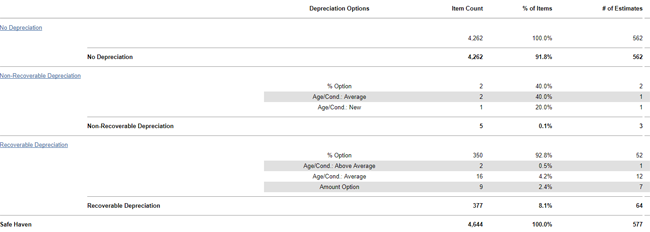
Estimate Depreciation Usage Line Item
This report displays line item data by depreciation type and age/use, helping you monitor how adjusters or contractors classify line items.
- Select a depreciation type to see data for other levels of your hierarchy, including individual estimates.
Columns
Depreciation Options: Options selected in Xactimate to categorize line items by age and use
Item Count: Number of items
% of Items: Percentage of items
# of Estimates: Number of estimates
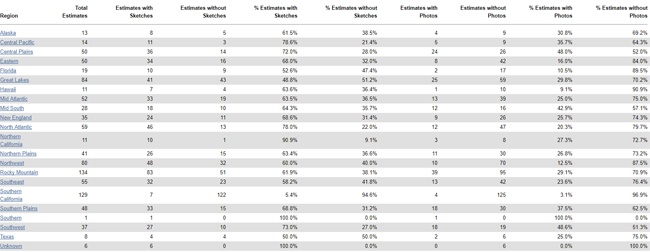
Estimates with Sketches and Photos
This report displays the number and percentage of estimates that have been uploaded with or without sketches and with or without photos. This helps you monitor which adjusters or contractors are uploading photos and sketches.
- Select a geographic/organizational area link to see data for other levels of your hierarchy, including individual estimates.
Columns
Region / Office Level: Geographic/organizational area
Total Estimates: Number of estimates
Estimates with Sketches: Number of estimates uploaded with a sketch
Estimates without Sketches: Number of estimates uploaded without a sketch
% Estimates with Sketches: Percentage of estimates uploaded with a sketch
% Estimates without Sketches: Percentage of estimates uploaded without a sketch
Estimates with Aerial Sketches: Number of estimates uploaded with aerial sketches
Estimates without Aerial Sketches: Number estimates uploaded without aerial sketches
% Estimates with Aerial Sketches: Percentage of estimates uploaded with aerial sketches
% Estimates without Aerial Sketches: Percentage of estimates uploaded without aerial sketches
Estimates with Photos: Number of estimates uploaded with a photo
Estimates without Photos: Number of estimates uploaded without a photo
% Estimates with Photos: Percentage of estimates uploaded with a photo
% Estimates without Photos: Percentage of estimates uploaded without a photo
Frequently Used Items
This report displays the price list items used in a given set of estimates, sorted from most frequently used to least frequently used.
- Select a category code to see data for other levels of your hierarchy, including individual estimates.
Columns
Category Code: Code for categorizing a line item
Selector Code: Code for selecting a line item
Description: Line item description
Item Count: Number of times line item was used
Estimates: Number of estimates
Total Item Value: Total line item value
Total Estimates Value: Total estimate value
Avg Item $ Value per Estimate: Average line item value per estimate (Total Item Value / Estimates)
Avg Estimate Value: Average estimate value (Total Estimates Value / Estimates)
Total ACV: Total actual cash value (RCV - Depreciation)
Total Net Value: Total Net Value
Hazardous Materials
This report displays estimate information by hazardous material removal category.
- Select a hazardous material removal category to see data for other levels of your hierarchy, including individual estimates.
Columns
Estimates: Number of estimates
Items: Number of hazardous material removal line items
Total Estimate Value: Total estimate value
Average Estimate Value: Average value per estimate (Total Estimate Value / Estimates)
Line Item Value: Hazardous material removal line item value
% of Estimates: Hazardous material line item value’s percentage of total estimate value
Average Line Item Value: Average hazardous material line item value per estimate (Line Item Value / Estimates)
Rows
Hazardous material removal categories
Data Set (Safe Haven): Totals

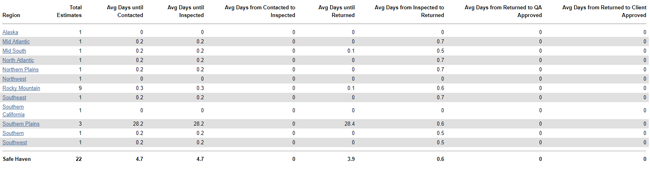
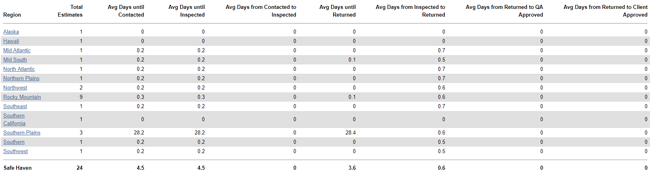
Initial Response Time
This report displays the original adjuster or contractor’s (the person who first returned the estimate) response times for each step of the estimate process. It shows returned estimate data only. The “start” time for the response time calculations is the Assignment Received date. This report helps you monitor adjuster and contractor activity, specifically their timeliness in progressing assignments.
- Select a geographic/organizational area link to see data for other levels of your hierarchy, including individual estimates.
Columns
Region / Office Level: Geographic/organizational area
Total Estimates: Number of estimates
Avg Days until Contacted: Average number of days for the status to change from Assignment Received (the date the assignment was first received into the Assignment Queue or first assigned to an adjuster and contractor) to Customer Contacted (recipient made first contact with insured)
Avg Days from Delivered until Contacted: Average number of days for the status to change from Assignment Delivered to Customer Contacted
Avg Days until Inspected: Average number of days for the status to change from Assignment Received (the date the assignment was first received into the Assignment Queue or first assigned to an adjuster and contractor) to Site Inspected (site inspected by assignment recipient)
Avg Days from Contacted to Inspected: Average number of days for the status to change from Customer Contacted (recipient made first contact with the insured) to Site Inspected (site inspected by assignment recipient)
Avg Days until Returned: Average number of days for the status to change from Assignment Received (the date the assignment was first received into the Assignment Queue or first assigned to an adjuster and contractor) to Returned (estimate returned to XactAnalysis from assignee)
Avg Days from Inspected to Returned: Average number of days for the status to change from Site Inspected (site inspected by assignment recipient) to Returned (estimate returned to XactAnalysis from assignee)
Avg Days from Returned to QA Approved: Average number of days for the status to change from Returned (estimate returned to XactAnalysis from assignee) to QA Approved
QA Approved to Client Approved: Average number of days for the status to change from QA Approved to Client Approved
Avg Days from Returned to Client Approved: Average number of days for the status to change from Returned (estimate returned to XactAnalysis from assignee) to Client Approved
Avg Days from Returned to Client Rejected: Average number of days for the status to change from Returned (estimate returned to XactAnalysis from assignee) to Client Rejected
Avg Days from Client Rejected to Correction Returned: Average number of days for the status to change from Client Rejected to Correction Returned (corrected estimate returned to XactAnalysis form assignee)
Avg Days from Client Rejected to QA Revision: Average number of days for the status to change from Client Rejected to QA Revision
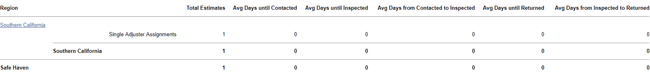
Initial Response Time Multiple Owners
This report displays the original adjuster or contractor’s (the person who first returned the estimate) response times for each step of the estimate process: contacted, inspected, contacted to inspected, returned, and inspected to returned. This report displays data for assignments with multiple recipients separately from assignments with a single recipient. The “start” time for the response time calculations is the Assignment Received date. This report helps you compare the original adjuster or contractor response times of estimates with single adjusters or contractors and estimates with multiple adjusters or contractors.
- Select a geographic/organizational area link to see data for other levels of your hierarchy, including individual estimates.
Columns
Region / Office Level: Geographic/organizational area
Total Estimates: Number of estimates
Avg Days until Contacted: Average number of days for the status to change from Assignment Received (the date the assignment was first received into the Assignment Queue or first assigned to an adjuster or contractor) to Customer Contacted (recipient made first contact with insured)
Avg Days until Inspected: Average number of days for the status to change from Assignment Received (the date the assignment was first received into the Assignment Queue or first assigned to an adjuster or contractor) to Site Inspected (site inspected by assignment recipient)
Avg Days from Contacted to Inspected: Average number of days for the status to change from Customer Contacted (recipient made first contact with insured) to Site Inspected (site inspected by assignment recipient)
Avg Days until Returned: Average number of days for the status to change from Assignment Received (the date the assignment was first received into the Assignment Queue or first assigned to an adjuster or contractor) to Returned (estimate returned to XactAnalysis from assignee)
Avg Days from Inspected to Returned: Average number of days for the status to change from Site Inspected (site inspected by assignment recipient) to Returned (estimate returned to XactAnalysis from assignee)
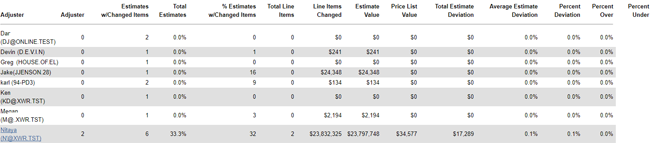
Items Changed by Adjuster/Contractor
This report displays changed line item data, including the number of line items changed and the dollar amount of estimate deviation as a result of changed items. This report helps you monitor changed line item activity by adjuster and contractor.
- Select an adjuster and contractor to see data for individual line items.
Columns
Adjuster/Contractor: Adjuster or contractor name
Estimates w/ Changed Items: Number of estimates with changed items
Total Estimates: Number of total estimates
% Estimates w/ Changed Items: Percentage of estimates with changed items
Total Line Items: Number of line items in all estimates
Line Items Changed: Number of line items changed (not including instances when the quantity of a line item is changed)
Estimate Value: Total estimate value (after items are changed)
Price List Value: Total price list item value (before items are changed)
Total Estimate Deviation*: Difference of total estimate value and total price list item value (Estimate Value – Price List Value)
Average Estimate Deviation: Average deviation per estimate with deviation (Total Estimate Deviation / Estimates w/ Changed Items)
Percent Deviation: Percentage of estimate deviation from price list value
Percent Over: Percentage of estimate deviation over price list value
Percent Under: Percentage of estimate deviation under price list value
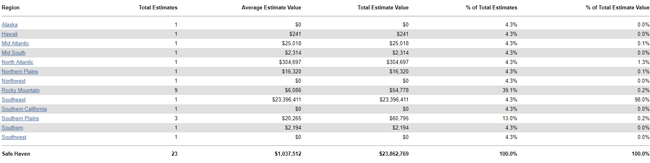
Loss Value Range
This report displays estimate information by type of loss and value range, helping you see trends in type of loss costs.
- Select a type of loss to see the information by value range. Then select a geographic/organizational area link to see data for other levels of your hierarchy, including individual estimates.
Columns
Type of Loss: Type of loss
Average Estimate Value: Average estimate value (Total Estimate Value / Total Estimates)
Total Estimates: Number of estimates
Total Estimate Value: Total estimate value
% of Total Estimates: Percentage of total estimates
% of Total Estimate Value: Percentage of total estimate value
Loss Value Range report
Loss Value Range report level 2
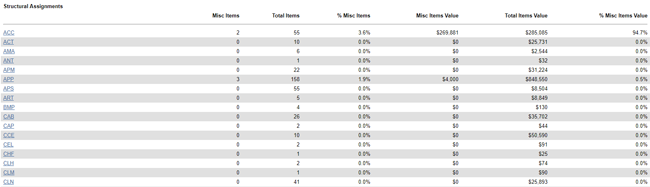
Miscellaneous Items
This report compares the number and cost of miscellaneous items (items that were not defined in the price list) with the number and cost of total items by structural category and contents assignments. Miscellaneous items may include user-defined items, items entered with the MISC Selector Code, and others.
- Select a trade category to see data for levels of your hierarchy, including individual estimates.
Columns
Structural/Contents Assignments: Trade categories separated by structural and contents assignments
Misc Items: Number of miscellaneous line items used
Total Items: Total number of line items used
% Misc Items: Percentage of miscellaneous line items out of total line items
Misc Items Values: Total value of miscellaneous line items
Total Items Value: Total value of line items
% Misc Items Value: Percentage of miscellaneous line item value out of total line item value
Payment Tracker
This report displays Payment Tracker data as recorded in Xactimate.
- Select a geographic/organizational area link to see data for other levels of your hierarchy, including individual estimates.
Columns
Region / Office Level: Geographic/organizational area
Estimates: Number of estimates
Average Estimate Value: Average estimate value (Total Estimate Value / Estimates)
Total Estimate Value: Total estimate value
Total Num Line Items: Number of line items
Average Num Line Items: Average number of line items per estimate (Total Num Line Items / Estimates)
Items Not Fully Paid: Number of items checked Partial in Payment Tracker
Contents Paid: Dollar amount paid for contents damages
Contents Recoverable Depreciation: Dollar amount the recoverable (i.e. covered by reinsurers) contents depreciated (i.e. decreased in value because of age and normal wear and tear)
Contents NR Dep: Dollar amount the non-recoverable (i.e. not covered by reinsurers) contents depreciated
Structural Paid: Dollar amount paid for structural damages
Structural Recoverable Depreciation: Dollar amount of recoverable structural depreciation
Structural NR Dep: Dollar amount of non-recoverable structural depreciation
Other Structures Paid: Dollar amount paid for other structures
Other Structures Recoverable Depreciation: Dollar amount of depreciation for recoverable structures other than the main structure
Other Structures Non-Recoverable Depreciation: Dollar amount of depreciation for non-recoverable structures other than the main structure
ALE (Additional Living Expenses) Paid: Dollar amount paid for additional living expenses, such as motel, restaurant, and laundromat expenses
Total Paid: Total dollar amount paid (Contents Paid + Structural Paid + Other Structures Paid + ALE Paid)
Total Recoverable Depreciation: Dollar amount of depreciation for structures and contents covered by reinsurers (Contents Recoverable Depreciation + Structural Recoverable Depreciation + Other Structures Recoverable Depreciation)
Total Non-Recoverable Depreciation: Dollar amount of depreciation for structures and contents not covered by reinsurers (Contents NR Dep + Structural NR Dep + Other Structures NR Dep)
Total Depreciation: Amount of depreciation for recoverable and non-recoverable contents and structures (Total Recoverable Depreciation + Total Non Recoverable Depreciation)
Total Remaining: Amount owed (Total Estimate Value - Total Paid)
Num Payments Issued: Total number of payments issued
Number of Item Overrides: Total number of item overrides
Item Override Amount: Dollar amount of item overrides
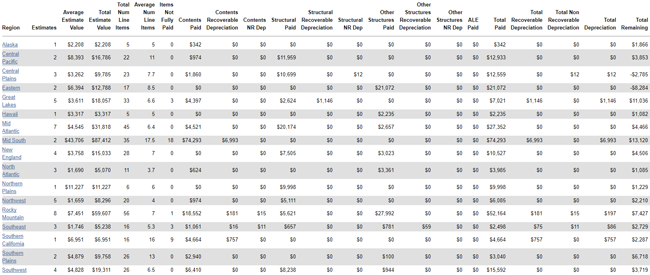
Payment Tracker report
Payment Tracker report, continued
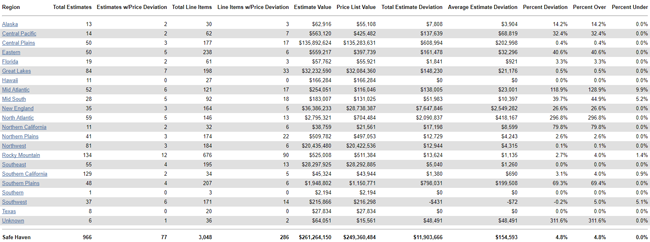
Price Deviations
This report displays information about estimates where prices deviated from the price list prices. For example, a price obtained from a local source could differ from a price list price. This report helps you determine which adjuster or contractor are changing prices and the extent of the price changes.
- Select a geographic/organizational area link to see data for other levels of your hierarchy, including individual estimates.
Columns
Region / Office Level: Geographic/organizational area
Total Estimates: Number of estimates
Estimates w/Price Deviation: Number of estimates with price deviation (line item price changed from price list price)
Total Line Items: Number of line items
Line Items w/Price Deviation: Number of line items with price deviation
Estimate Value: Estimate value
Price List Value: Total estimate value of estimates using the check point price list for each line item (Estimate Value - Total Estimate Deviation)
Total Estimate Deviation: Difference between the estimate value and the price list value (Estimate Value - Price List Value)
Average Estimate Deviation: Average dollar amount of deviations per estimate (Total Estimate Deviation / Estimates w/Price Deviation)
Percent Deviation: Percentage of deviation from price list value
Percent Over: Percentage of deviation if over the price list value
Percent Under: Percentage of deviation if under the price list value
Response Time
This report displays the last assigned adjuster or contractor’s response times for each step of the estimate process. The “start” time for the response time calculations is the Assignment Received date. This report helps you monitor adjuster and contractor activity, specifically their timeliness in progressing assignments.
- Select a geographic/organizational area link to see data for other levels of your hierarchy, including individual estimates.
Columns
Region / Office Level: Geographic/organizational area
Total Estimates: Number of estimates
Avg Days until Contacted: Average number of days from status Assignment Received (the date the assignment was first received into the Assignment Queue or first assigned to an adjuster and contractor) to Customer Contacted (recipient made first contact with insured)
Avg Days until Inspected: Average number of days from status Assignment Received (the date the assignment was first received into the Assignment Queue or first assigned to an adjuster and contractor) to Site Inspected (site inspected by assignment recipient)
Avg Days from Contacted to Inspected: Average number of days from status Customer Contacted (recipient made first contact with the insured) to Site Inspected (site inspected by assignment recipient)
Avg Days until Returned: Average number of days from status Assignment Received (the date the assignment was first received into the Assignment Queue or first assigned to an adjuster and contractor) to Returned (estimate returned to XactAnalysis from assignee)
Avg Days from Inspected to Returned: Average number of days from status Site Inspected (site inspected by assignment recipient) to Returned (estimate returned to XactAnalysis from assignee)
Avg Days from Returned to QA Approved: Average number of days from status Returned (estimate returned to XactAnalysis from assignee) to QA Approved
Avg Days from Returned to Client Approved: Average number of days from status Returned (estimate returned to XactAnalysis from assignee) to Client Approved
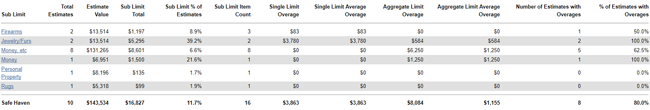
Sub Limits
This report displays sub limits and instances where they were or were not exceeded.
- Select a sub limit to see data for other levels of your hierarchy, including individual estimates.
Columns
Sub Limit: Type of sub limit (i.e. firearms, jewelry, money, etc.) you set up on your account
Total Estimates: Number of estimates
Estimate Value: Estimate value
Sub Limit Total: Value of sub limits
Sub Limit % of Estimates: Sub limit value’s percentage of total estimate value
Sub Limit Item Count: Number of items that have sub limits
Single Limit Overage: Dollar amount the estimates exceeded their sub limits
Single Limit Average Overage: Average dollar amount the estimates exceeded their sub limits (Single Limit Overage / Number of Estimates with Overages)
Aggregate Limit Overage: Dollar amount the estimates exceeded their aggregate limit (total coverage limit of the estimate), not just the sub limit
Aggregate Limit Average Overage: Average dollar amount estimates exceeded their aggregate limit (total coverage limit of the estimate), not just the sub limit (Aggregate Limit Overage / Number of Estimates with Overages)
Number of Estimates with Overages: Number of estimates that went over their sub limit and/or aggregate limit
% of Estimates with Overages: Percentage of estimates listed that went over their sub limit and/or aggregate limit
Supplement
This report displays supplement estimate information, including the number of supplements and their value. A supplement is created when an estimate has been closed but is then reopened so changes can be made.
- Select a geographic/organizational area link to see data for other levels of your hierarchy, including individual estimates.
Columns
Region / Office Level: Geographic/organizational area
Total Estimates: Number of total estimates
Total Supplements: Number of supplements
Supplement Percentage of Estimates: Percentage of supplements out of total estimates
Total Supplement Value: Total supplement value
Avg Supplement Amount: Average supplement value
Supplements and Corrections by Reason
This report displays supplement and corrections estimate information by the reason for the supplement or correction. A supplement is created when an estimate has been closed but is then reopened so changes can be made. Select a reason or geographic/organizational area link to see data for other levels of a hierarchy, including individual estimates.
Corrections Columns
Reason: The reason for the correction (for example: Claim Info/Admin, Line Item/Summary, Reinspection)
Total Returned Estimates: Total number of returned estimates
Total Returned Estimate Value: Total value of returned estimates
Avg. Returned Estimate Value: Average value of returned estimates
Total Assignments with Corrections: Total number of assignments with corrections
Total Estimate Value with Corrections: Total value of estimates with corrections
Total # of Corrections: Total number of corrections made to estimates
Total # Onsite: Total number of estimates that were created at the loss location
Correction % of all Estimates: Percent of estimates that had corrections
Total Correction Value: Total value of corrections
Avg. Correction Value: Average value of corrections
% Increase of Estimate with Correction: The percent of the increase in value of only estimates with corrections
% Increase of All Estimates: The percent of the increase in value of all estimates resulting from corrections
Supplements Columns
Reason: The reason for the supplement (for example: Code Issues, Open Items, Pricing, Reinspection, Scope Changes)
Total Returned Estimates: Total number of returned estimates
Total Returned Estimate Value: Total value of returned estimates
Avg. Returned Estimate Value: Average value of returned estimates
Total Assignments with Supplements: Total number of assignments with supplements
Total Estimate Value with Supplements: Total value of estimates with supplements
Total # of Supplements: Total number of supplements added to estimates
Total # Onsite: Total number of estimates that were created at the loss location
Supplement % of all Estimates: Percent of estimates that had supplements
Total Supplement Value: Total value of corrections
Avg. Supplement Value: Average value of corrections
% Increase of Estimate with Supplement: The percent of increase in value of only estimates with supplements
% Increase of All Estimates: The percent of the increase in value of all estimates resulting from supplements
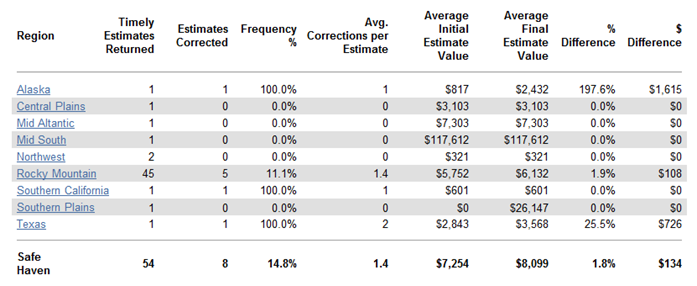
Timely Estimate Variance
This report compares the value of initial estimates returned within five days to the value of the final estimates uploaded. It also displays frequency and number of corrections in these estimates.
- Select a geographic/organizational area link to see data for other levels of your hierarchy, including individual estimates.
Columns
Region / Office Level: Geographic/organizational area
Timely Estimates Returned: Number of estimates returned within five days from Assignment Received date
Estimates Corrected: Number of estimates returned within five days that had a correction
Frequency %: Percentage of estimates returned that had a correction
Average Corrections per Estimate: Average number of corrections per estimate
Average Initial Estimate Value: Average value of initial estimates uploaded
Average Final Estimate Value: Average value of final estimates uploaded
% Difference: Percentage difference between total initial estimate value and total final estimate value
$ Difference: Difference between total final estimate value and total initial estimate value
Total Claims Volume
This report displays the distribution of claims across data sets in a company. Select a data set link to see data for other levels of a hierarchy, including individual estimates.
Columns
Data set: Data set name
Average Total Value per Claim: Average value per claim
Total Claim Value: Total value of claims
Number of Claims by Data set: Number of claims in each data set
Percent of Claim Volume: Percent of total claim volume in each data set
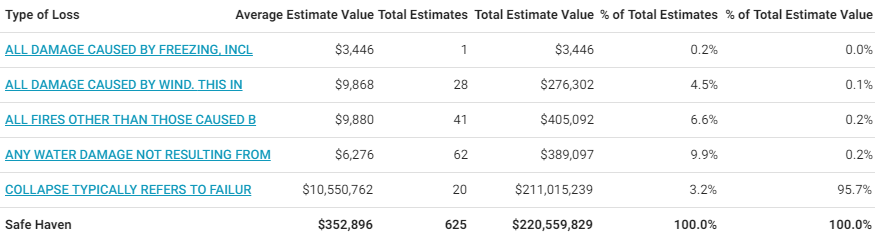
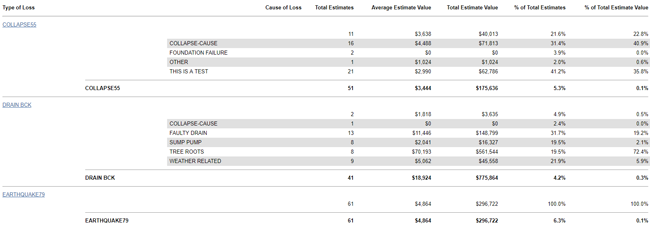
Type of Loss
This report displays estimate information by type of loss, helping you see trends in type of loss costs.
- Select a type of loss to see data for your hierarchy levels, including individual estimates.
Columns
Type of Loss: Type of Loss category (Collapse, Earthquake, etc.)
Cause of Loss: Cause of Loss category (Cause of loss categories for a Fire type of loss could include Candle, Cooking, Defective Appliance, etc.)
Total Estimates: Number of estimates
Average Estimate Value: Average estimate value (Total Estimate Value / Total Estimates)
Total Estimate Value: Total estimate value
% of Total Estimates: Percentage of total estimates
% of Total Estimate Value: Percentage of total estimate value
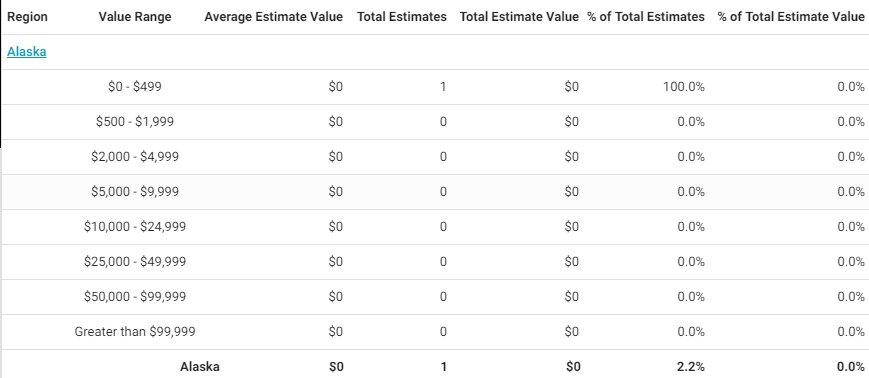
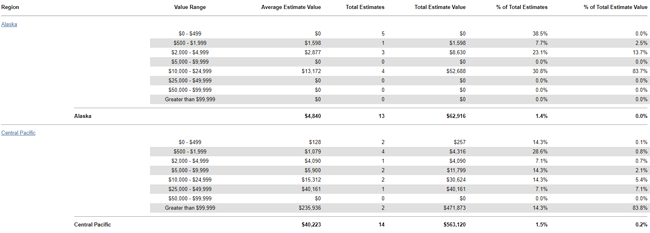
Value Range
This report displays estimate information by value range and region / office level, helping you track estimates by value range.
- Select a geographic/organizational area link to see data for other levels of your hierarchy, including individual estimates.
Columns
Region / Office Level: Geographic/organizational area
Value Range:
- $0–$499
- $500–$1,999
- $2,000–$4,999
- $5,000–$9,999
- $10,000–$24,999
- $25,000–$49,999
- $50,000–$99,999
- Greater than $99,999
Average Estimate Value: Average estimate value (Total Estimate Value / Total Estimates)
Total Estimates: Number of estimates
Total Estimate Value: Estimate total value
% of Total Estimates: Percentage of total estimates
% of Total Estimate Value: Percentage of total estimate value
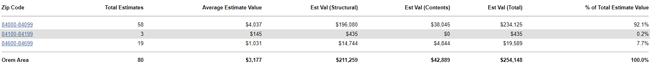
ZIP Codes
This report displays estimate value information by zip code, helping you track the work completed in zip code areas.
Select a geographic/organizational area link to see data by zip code and for other levels of your hierarchy, including individual estimates.
Columns
Region / Office Level: Geographic/organizational area
Total Estimates: Number of estimates
Average Estimate Value: Average estimate value (Total Estimate Value / Total Estimates)
Total Estimate Value: Estimate total value
% of Total Estimate Value: Percentage of total estimate value
Zip Codes report
Zip Codes report level 3 (this can vary depending on your company’s hierarchy)