Activity Reports
 Updated
by
Mara K
Updated
by
Mara K
- Agent Claim Volume
- Assignment Aging
- Assignment Summary
- Average File Size
- Adjuster/Contractor Activity
- Claim Summary
- Contents Comparison
- Contents Line Item Summary by Adjuster
- Estimate Collaboration Summary
- Estimate Correction Summary
- Estimate Review Summary
- Executive Overview with Onsite Payment by Adjuster
- In Progress Adjuster/Contractor Activity
- Pending Assignments
- Summarized Executive Overview
- Summarized Executive Overview with Onsite Payment
- User Productivity
The following Activity reports are available in XactAnalysis®, depending on your company’s settings and your rights. See Management/Activity Reports for help with generating reports.
For most reports, select a row heading in the table or a geographic/organizational area in the hierarchy tree to see data for other levels of your hierarchy.
Agent Claim Volume
This report helps a company analyze the volume and progress of claims processed by each agent. A company can analyze industry-wide information or drill down into specific geographic regions or individual agents.
Columns
Agent/District Code: Agent name or district code
In Queue: Number of assignments in the assignment queue
In Progress: Number of assignments in progress
Notified: Number of assignments for which the adjuster or contractor was notified via email, fax, or phone
Delivered: Number of assignments downloaded by the adjuster or contractor
Returned: Number of assignments completed and uploaded back to XactAnalysis
Referrals: Number of referral assignments. An assignment is referred (or segmented) when more than one contractor is needed. For example, a damaged home may need a carpet contractor, a roofing contractor, and a drywall contractor. Each would receive a referral assignment.
Reassigned: Number of assignments reassigned from this adjuster or contractor to another adjuster or contractor
Corrected: Number of assignments with a corrected estimate uploaded into XactAnalysis
Cancelled: Number of assignments cancelled in XactAnalysis or by EDI by the carrier
Rejected: Number of assignments rejected or deleted by the adjuster or contractor in Xactimate
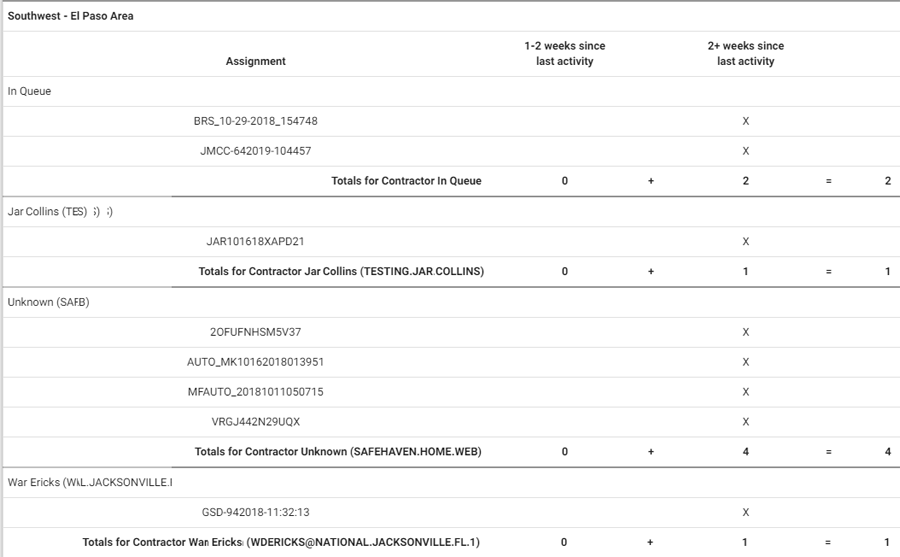
Assignment Aging
This report displays information about assignments with 1–2 weeks and 2+ weeks of inactivity, by area, adjuster or contractor, and claim number. Inactive assignments have not been returned to XactAnalysis, cancelled, or rejected. This information helps to make you aware of adjusters and contractors with aging assignments. Assignments are removed once they are returned, cancelled, or rejected.
The date range for this report is the 12 months prior to the report generation date. Ad hoc date ranges are not used, as the intent is to display current data rather than data for a specific period of time.
Columns
Assignment: Claim number and the adjuster or contractor
1-2 weeks since last activity: Number of aging assignments with 1-2 weeks of inactivity
2+ weeks since last activity: Number of aging assignments with 2+ weeks of inactivity
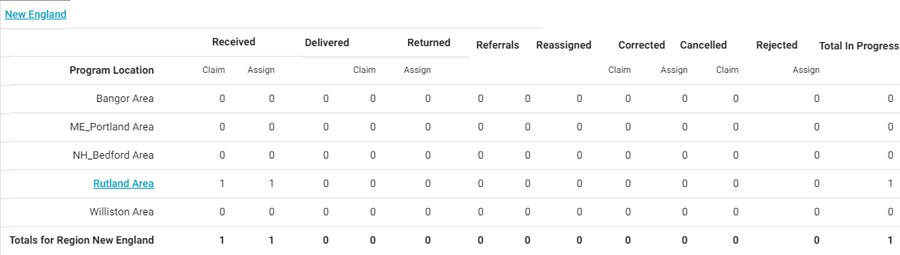
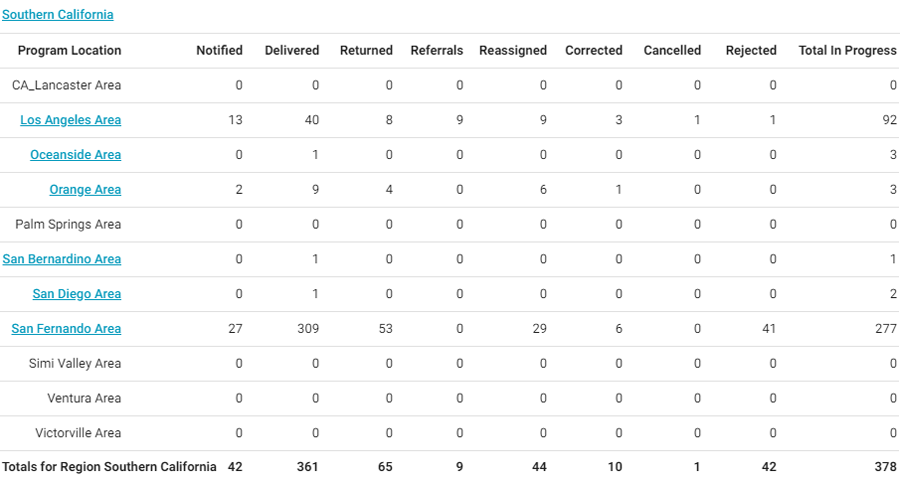
Assignment Summary
This report displays the statuses assignments receive during the report’s date range. It separates the assignment totals for some of the statuses by those with duplicate claim number and those without duplicate claim number. This report helps you track assignment activity volume by geographic/organizational area.
- Select a geographic/organizational area link to see data for different levels of your hierarchy, including individual estimates.
Columns
Received: Number of assignments received by XactAnalysis
- Claim: Number of unique claim numbers received, excluding any duplicates
- Assign: Number of all assignments received, including those with duplicate claim numbers
Delivered: Number of assignments downloaded to Xactimate®
Returned: Number of estimates returned to XactAnalysis from the assignee
- Claim: Number of unique claim numbers returned, excluding duplicates
- Assign: Number of all assignments returned, including those with duplicate claim numbers
Referrals: Number of referral assignments. An assignment is referred (or segmented) when more than one contractor is needed. For example, a damaged home may need a carpet contractor, a roofing contractor, and a drywall contractor. Each would receive a referral assignment.
Reassigned: Number of assignments reassigned to a different recipient. When an assignment is reassigned, a new assignment is actually created, but it keeps the original estimate line items. An assignment could be reassigned if a carrier wanted a second opinion.
Corrected: Number of corrected estimates uploaded to XactAnalysis
Cancelled: Number of assignments cancelled by the carrier and notifications to assignment recipient sent
- Claim: Number of unique claim numbers cancelled, excluding duplicates
- Assign: Number of assignments cancelled, including those with duplicate claim numbers
Rejected: Number of assignments rejected/deleted by assignment recipient and notifications to carrier sent
- Claim: Number of unique claim numbers rejected, excluding duplicates
- Assign: Number of assignments rejected, including those with duplicate claim numbers
Total In Progress: Number of assignments not returned to XactAnalysis by a recipient. These assignments will have an assignment status of In Assign Queue (not assigned to a recipient), Notification Pending (assigned, but recipient has not received notification), Notified (recipient notified), or Delivered (downloaded to Xactimate).
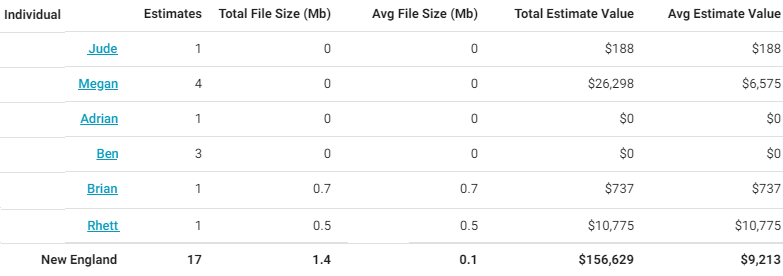
Average File Size
This report displays the total and average file size and value of estimates, by adjuster or contractor. File size is influenced by custom documents, photos, and sketch files uploaded from Xactimate or through XactAnalysisSP. This report helps you administer computer disc space.
- Select an adjuster or contractor to view estimate details.
Columns
Individual: Adjuster or contractor name and XactNet address
Estimates: Number of estimates
Total File Size (MB): Total file size of estimates, in megabytes
Avg File Size (MB): Average estimate file size, in megabytes (Total File Size / Estimates)
Total Estimate Value: Total value of estimates
Avg Estimate Value: Average estimate value (Total Estimate Value / Estimates)
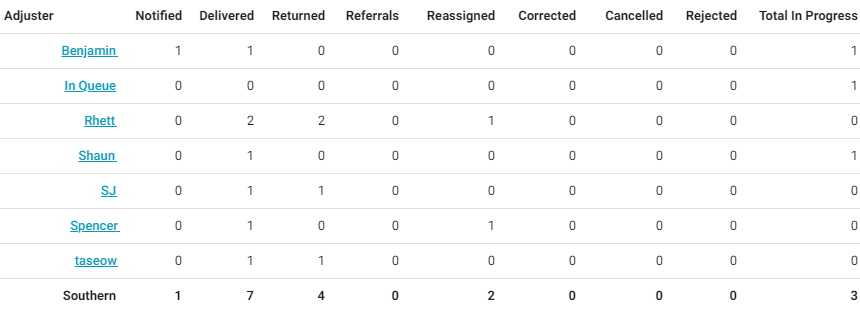
Adjuster/Contractor Activity
This report displays the statuses of assignments by adjuster or contractor, helping you monitor assignment activity.
- Select an adjuster or contractor name to view estimate details, including the date and time each status was reached.
Columns
Adjuster/Contractor: Assignee name and XactNet address
Notified: Number of assignments where the assignee was notified
Delivered: Number of assignments downloaded to Xactimate
Returned: Number of estimates exported to carrier or there is no export
Referrals: Number of referral assignments
Reassigned: Number of assignments reassigned to a different assignee
Corrected: Number of corrected estimates uploaded to XactAnalysis
Cancelled: Number of assignments cancelled by the carrier and notifications to assignment assignees sent
Rejected: Number of assignments rejected/deleted by assignment assignee and notifications to carrier sent
Total In Progress: Number of assignments not returned to XactAnalysis by an assignee. These will have an assignment status of In Assign Queue (not assigned to an assignee), Notification Pending, Notified (assignee notified), or Delivered (downloaded to Xactimate).
Claim Summary
Similar to the Assignment Summary report, this report displays the statuses claims receive during the report’s date range by region or office level. One claim may have multiple assignments associated with it. This report separates the assignment totals for some statuses by those with and without duplicate claim numbers.
- Select a geographic/organizational area link to see data for different levels of a company’s hierarchy, including individual estimates.
Columns
Region: Geographic region or organizational level
Received: Number of assignments received by XactAnalysis
- Claim: Number of unique claim numbers received, excluding any duplicates
- Assign: Number of all assignments received, including those with duplicate claim numbers
Delivered: Number of assignments downloaded to Xactimate
Returned: Number of estimates returned to XactAnalysis from the assignee
- Claim: Number of unique claim numbers returned, excluding duplicate claim numbers
- Assign: Number of all assignments returned, including those with duplicate claim numbers
Reassigned: Number of assignments reassigned to a different recipient. When an assignment is reassigned, a new assignment is actually created, but it keeps the original estimate line items. An assignment could be reassigned if a carrier wanted a second opinion.
Corrected: Number of corrected estimates uploaded to XactAnalysis
Cancelled: Number of assignments cancelled by the carrier and notifications to assignment recipient sent
- Claim: Number of unique claim numbers cancelled, excluding duplicates
- Assign: Number of assignments cancelled, including those with duplicate claim numbers
Rejected: Number of assignments rejected or deleted by assignment recipient and notifications to carrier sent
- Claim: Number of unique claim numbers rejected, excluding duplicates
- Assign: Number of assignments rejected, including those with duplicate claim numbers
Total In Progress: Number of assignments not returned to XactAnalysis by a recipient. These assignments will have an assignment status of In Assign Queue (not assigned to a recipient), Notification Pending (assigned, but recipient has not received notification), Notified (recipient notified), or Delivered (downloaded to Xactimate).
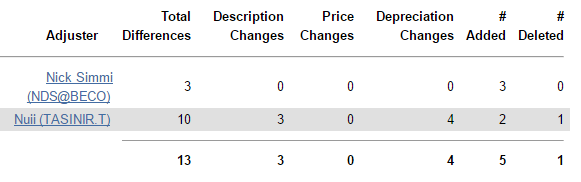
Contents Comparison
This report compares your company's XactContents reports with previously created baseline XactContents reports from a third-party company. You can click any of the adjuster names to see detailed information from each of the reports.
Columns
Adjuster/Contractor: Name and XactNet address of the adjuster or contractor that submitted the XactContents report
Total Differences: The total number of differences found between the XactContents reports
Description Changes: Number of items with changes made to their description
Price Changes: Number of items with changes made to their price
Deprecation Changes: Number of items with changes made to their depreciation amount
# Added: Number of items added to the XactContents report
# Deleted: Number of items deleted from the XactContents report
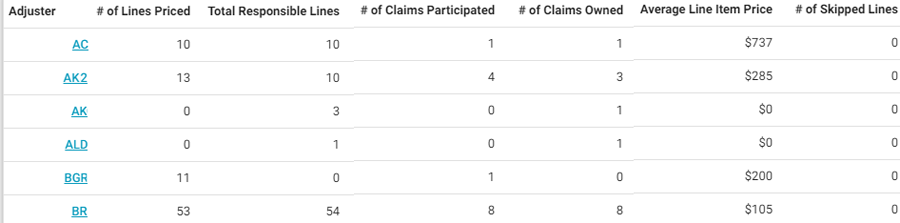
Contents Line Item Summary by Adjuster
This report displays the number of contents line items priced by each adjuster or contractor (initial assignee or collaborator), the number of line items for which each adjuster or contractor is responsible, and the number of claims participated by each adjuster or contractor. It also shows the average number of line items per claim as well as the average price per line item and the number of skipped lines. This report helps you monitor the cost of line items added to estimates by each adjuster or contractor.
- Select a contractor / claim rep to view estimate details.
Columns
Adjuster/Contractor: The adjuster or contractor (initial assignee or collaborator) name and XactNet address
# of Lines Priced: Number of lines priced by each adjuster or contractor (initial assignee or collaborator)
Total Responsible Lines: Number of lines for which each adjuster or contractor (initial assignee or collaborator) is responsible
# of Claims Participated: Number of claims participated by each adjuster or contractor (initial assignee or collaborator) where they priced one or more items
# of Claims Owned: Number of claims owned by the adjuster or contractor (assignee)
Average Lines Priced Per Claim: Average number of lines priced per claim (# of Lines Priced / # of Claims Participated)
Average Line Item Price: Average price per line item
# of Skipped Lines: Number of line items marked as “skipped”
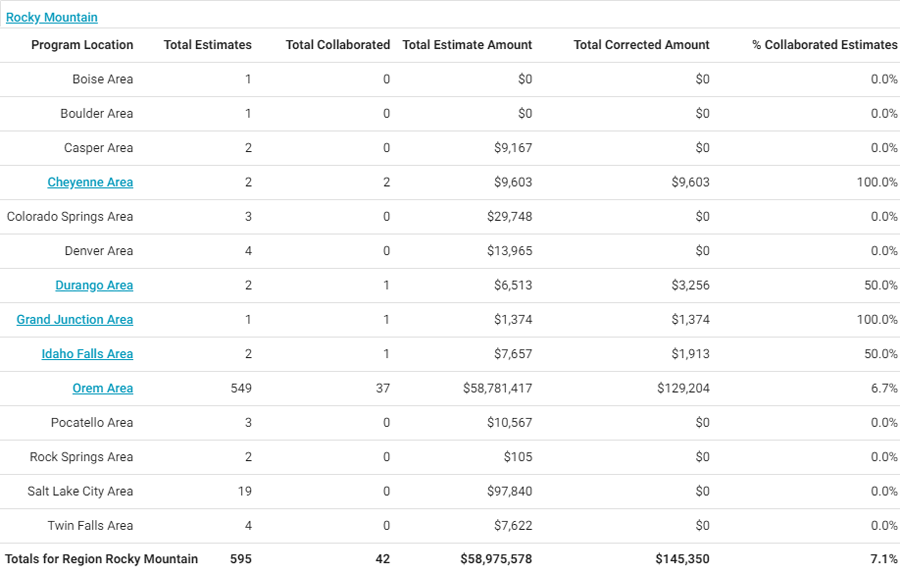
Estimate Collaboration Summary
This report displays the number of estimates where collaboration occurred and the details of the collaborations. Collaboration occurs when an assignment is assigned to a collaborating adjuster who reviews the assignment and makes corrections using Xactimate while the original adjuster is locked out. The original adjuster can pick up the assignment again when the collaborating adjuster is finished. This report allows you to review original estimates for accuracy through comparison of original and collaborated estimates.
- Select a geographic/organizational area link to see data for different levels of your hierarchy, including individual estimates.
Columns
Program Location: Geographic/organizational area
Total Estimates: Total number of estimates
Total Collaborated: Total number of collaborated estimates
# Assigned: Number of estimates assigned to a collaborator
# Returned: Number of estimates returned to a collaborator
Avg. Collaboration Days: Average number of days the collaboration lasted
Total Estimate Amount: Total estimate value before collaborations
Total Corrected Amount: Total value of corrected estimates
% Collaborated Estimates: Percent of total estimates collaborated
$ Difference (Overall): Difference in value between original estimates and collaborated estimates (last uploaded estimates)
$ Difference (Up): Difference in value between original estimates and collaborated estimates (last uploaded estimates) if they increased in value
$ Difference (Down): Difference in value between original estimates and collaborated estimates (last uploaded estimates) if they decreased in value
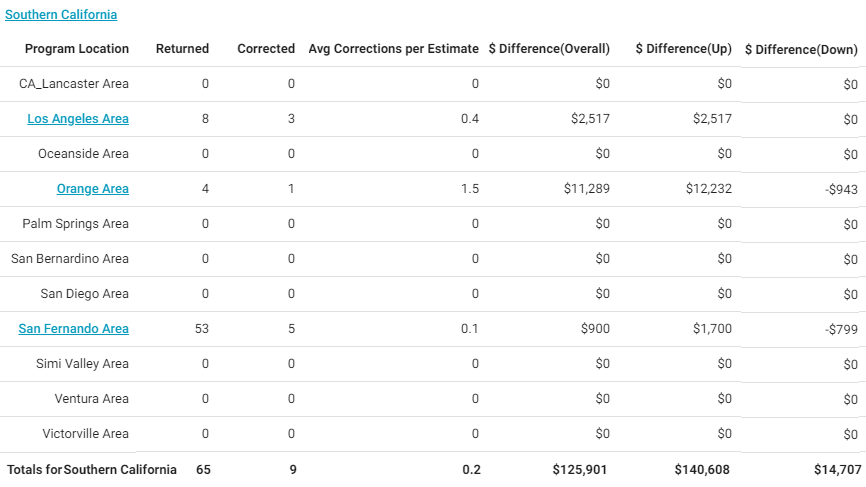
Estimate Correction Summary
This report displays the number of corrections on each estimate and cost total differences between the first and last uploaded estimate. This report helps you track corrections on estimates and monitor the difference corrections make in the final estimate value.
- Select a geographic/organizational area link to see data for different levels of your hierarchy, including individual estimates.
Columns
Returned: Number of returned (initial) estimates
Corrected: Number of corrected (final) estimates
Avg Corrections per Estimate: Average number of corrections uploaded for each returned (initial) estimate (Total # of Corrections column total in Program Area table divided by number of Returned estimates in Region / Office Level table).
Initial Est Value: Value of returned (initial) estimates
Final Est Value: Value of corrected (final) estimate
% Difference (Overall): Percentage of change between Initial Est Value and Final Est Value. This number can be positive or negative.
$ Difference (Overall): Difference between Final Estimate Value and Initial Estimate Value (Final Est Value – Initial Est Value). This amount can be positive or negative.
% Difference (Up): Percentage of increase from Initial Estimate Value to Final Estimate Value
$ Difference (Up): Amount of increase from Initial Estimate Value to Final Estimate Value (Final Est Value – Initial Est Value)
% Difference (Down): Percentage of decrease from Initial Estimate Value to Final Estimate Value
$ Difference (Down): Amount of decrease from Initial Estimate Value to Final Estimate Value (Initial Est Value – Final Est Value)
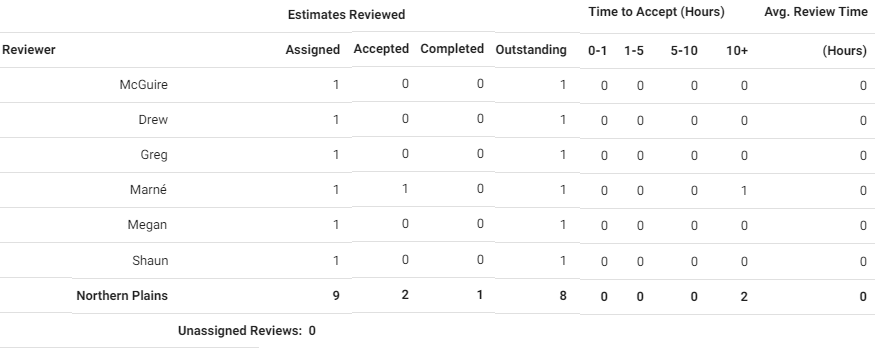
Estimate Review Summary
This report displays information about each of the assigned reviewers, including number of reviews assigned, accepted, completed, and outstanding. It also displays the time it took for the reviewer to accept each review, and the average review time. This report helps you monitor your reviewers’ productivity.
Columns
Reviewer: Reviewer name
Estimates Reviewed Assigned: Number of estimates assigned to the reviewer
Estimates Reviewed Accepted: Number of estimate reviews accepted by the reviewer
Estimates Reviewed Completed: Number of estimate reviews completed by the reviewer
Estimates Reviewed Outstanding: Number of estimates still in progress (Assigned estimates - Completed estimates). The estimate will have any review status except Review Completed.
Time to Accept (Hours): Number of hours reviewer took to accept the review (Number of hours between Assigned and Accepted)
- 0-1 Hours
- 1-5 Hours
- 5-10 Hours
- 10+ Hours
Avg. Review Time (Hours): Average number of hours reviewer took to complete the review (Number of hours between Assigned and Completed)
Executive Overview with Onsite Payment by Adjuster
This report displays assignment statuses. If an assignment progressed through multiple statuses during the date range of the report, the report would count each of the statuses. For example, if an adjuster was notified about an assignment, the assignment was downloaded by the adjuster, and the estimate was uploaded to XactAnalysis during the report’s date range, the report would show a count for Notified, Delivered, and Returned. This report is similar to the Summarized Executive Overview with Onsite Payment report (both include information about payments and onsite inspections), but shows the result by adjuster instead of geographic hierarchy.
- Select a geographic/organizational area link to see data for different levels of a company’s hierarchy, including individual estimates. Select an adjuster to see estimates associated with that adjuster.
Columns
Adjuster: The adjuster name and XactNet address, or In Queue
Notified: Number of assignments where the assignee was notified
Delivered: Number of assignments downloaded to Xactimate
Returned: Number of estimates submitted to XactAnalysis
Reassigned: Number of assignments reassigned to a different recipient. A new assignment is actually created, but it keeps the original estimate line items. An assignment could be reassigned if a carrier wanted a second opinion, for instance.
Corrected: Number of corrected estimates uploaded to XactAnalysis
Cancelled: Number of assignments cancelled by the carrier
Rejected: Number of assignments rejected/deleted by the assignment recipient
Total In Progress: Number of assignments not returned to XactAnalysis by an adjuster. These assignments have an assignment status of In Assign Queue (not assigned to a recipient), Notification Pending, Notified (recipient notified), or Delivered (downloaded to Xactimate).
Manual Payment: Number of assignments that had a manual payment made to the claimant on site
Onsite Inspection: Number of assignments that had an inspection performed on site
Printed Onsite: Number of assignments where the adjuster gave a printed estimate to the claimant on site
One and Done: Number of assignments that received all of the following: an onsite inspection, a printed estimate on site, and an onsite manual payment
In Progress Adjuster/Contractor Activity
This report displays the statuses of In Progress assignments by adjuster or contractor. In Progress assignments have been created but not yet returned with an estimate or cancelled. This report helps you monitor adjusters' and contractors’ In Progress assignment activity.
- Select an adjuster or contractor name to view estimate details for Delivered estimates only, including the date and time each status was reached.
Columns
Adjuster/Contractor: The adjuster or contractor name and XactNet address
Notified: Number of assignments where the assignee was notified
Delivered: Number of assignments delivered to an assignee in Xactimate
Referrals: Number of referral assignments
Rejected: Number of assignments rejected/deleted by assignment assignees and notifications to carrier sent
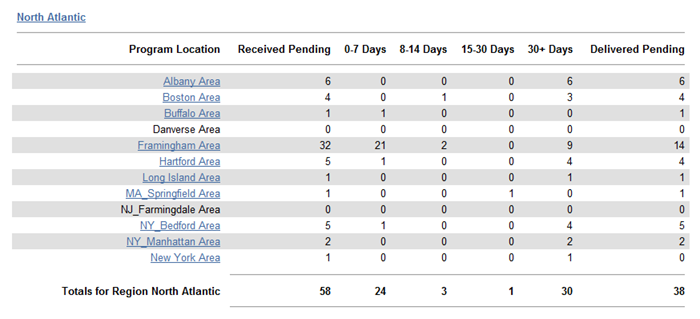
Pending Assignments
This report displays information about assignments that have been downloaded by a recipient in Xactimate but have not been returned to XactAnalysis or cancelled. The report summarizes the length of time assignments have been accepted but not returned, helping you identify which assignments most need attention. The date range for this report is always the 12 months prior to the report generation date. Ad hoc date ranges are not used for this report as its intent is to display all In Progress assignments.
- Select a geographic/organizational area link to see data for different levels of your hierarchy, including individual estimates.
Columns
Program Location: Geographic/organizational area
Received Pending: Number of assignments assigned to recipients but not yet downloaded to Xactimate
0-7 Days: Number of pending assignments with 0-7 days since last activity
8-14 Days: Number of pending assignments with 8-14 days since last activity
15-30 Days: Number of pending assignments with 15-30 days since last activity
30+ Days: Number of pending assignments with 30+ days since last activity
Delivered Pending: Number of assignments downloaded to Xactimate but not accepted or rejected
Summarized Executive Overview
This report displays assignment statuses. If an assignment progressed through multiple statuses during the date range of the report, the report would count each of the statuses. For example, if an adjuster or contractor was notified about an assignment, the assignment was downloaded by the adjuster or contractor, and the estimate was uploaded to XactAnalysis during the report’s date range, the report would show a count for Notified, Delivered, and Returned.
- Select a geographic/organizational area link to see data for different levels of your hierarchy, including individual estimates.
Columns
Program Area: Geographic/organizational area
Notified: Number of assignments where the recipient was notified
Delivered: Number of assignments downloaded to Xactimate
Returned: Number of estimates submitted to XactAnalysis
Referrals: Number of referral assignments. An assignment is referred (or segmented) when more than one adjuster or contractor is needed. For example, a damaged home may need a carpet contractor, a roofing contractor, and a drywall contractor. Each would receive a referral assignment.
Reassigned: Number of assignments reassigned to a different recipient. A new assignment is actually created, but it keeps the original estimate line items. An assignment could be reassigned if a carrier wanted a second opinion.
Corrected: Number of corrected estimates uploaded to XactAnalysis
Cancelled: Number of assignments cancelled by the carrier
Rejected: Number of assignments rejected/deleted by the assignment recipient
Total In Progress: Number of assignments not returned to XactAnalysis by an adjuster or contractor. These assignments have an assignment status of In Assign Queue (not assigned to a recipient), Notification Pending, Notified (recipient notified), or Delivered (downloaded to Xactimate).
Summarized Executive Overview with Onsite Payment
This report displays assignment statuses. If an assignment progressed through multiple statuses during the date range of the report, the report would count each of the statuses. For example, if an adjuster or contractor was notified about an assignment, the assignment was downloaded by the adjuster or contractor, and the estimate was uploaded to XactAnalysis during the report’s date range, the report would show a count for Notified, Delivered, and Returned. This report varies from the Summarized Executive Overview because it includes information about payments and onsite inspections.
- Select a geographic/organizational area link to see data for different levels of a company’s hierarchy, including individual estimates.
Columns
Region: Geographic region or organizational level
Notified: Number of assignments where the assignee was notified
Delivered: Number of assignments downloaded to Xactimate
Returned: Number of estimates submitted to XactAnalysis
Reassigned: Number of assignments reassigned to a different recipient. A new assignment is actually created, but it keeps the original estimate line items. An assignment could be reassigned if a carrier wanted a second opinion, for instance.
Corrected: Number of corrected estimates uploaded to XactAnalysis
Cancelled: Number of assignments cancelled by the carrier
Rejected: Number of assignments rejected by the assignment recipient
Total In Progress: Number of assignments not returned to XactAnalysis by an adjuster or contractor. These assignments have an assignment status of In Assign Queue (not assigned to a recipient), Notification Pending, Notified (recipient notified), or Delivered (downloaded to Xactimate).
Manual Payment: Number of assignments that had a manual payment made to the claimant on site
Onsite Inspection: Number of assignments that had an inspection performed on site
Printed Onsite: Number of assignments where the adjuster or contractor gave a printed estimate to the claimant on site
One and Done: Number of assignments that received all of the following: an onsite inspection, a printed estimate onsite, and an onsite manual payment
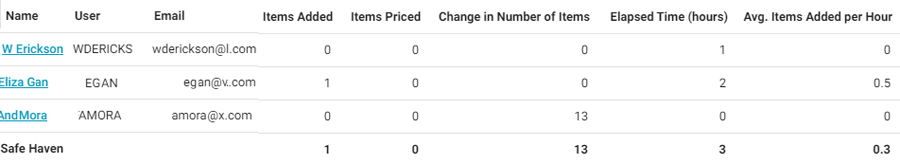
User Productivity
This report displays the volume and rate of items added and priced, by vendor. This helps you see the productivity of specific vendors.
- Select a vendor to view information for individual estimates.
Columns
Name: Vendor name
User: Vendor user name
Email: Vendor email
Contents Collab Items Added: Number of line items that were added through the contents collaboration process
Excel Items Added: Number of line items that were added using an Excel worksheet
Normal Items Added: Number of items that were added normally
Items Priced: Number of items priced
Change in Number of Items: Total number of items changed
Elapsed Time (hours): Number of hours logged into XactContents
Avg. Items Added per Hour: Average number of items added per hour
Avg. Items Priced per Hour: Average number of items priced per hour