Search overview
 Updated
by
Arianne G.
Updated
by
Arianne G.
On the Search tab, simply type what data you want to see into the search bar, and XactInsights will create a report for you. Your results will appear as either a table or a chart, which you can change and customize as needed.
Finding data in XactInsights Search
Select data sources
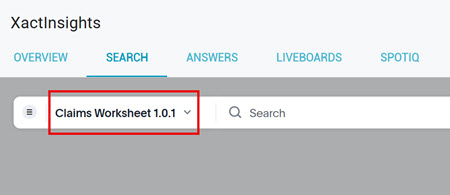
To get started in XactInsights Search, select the worksheets you want to work from.
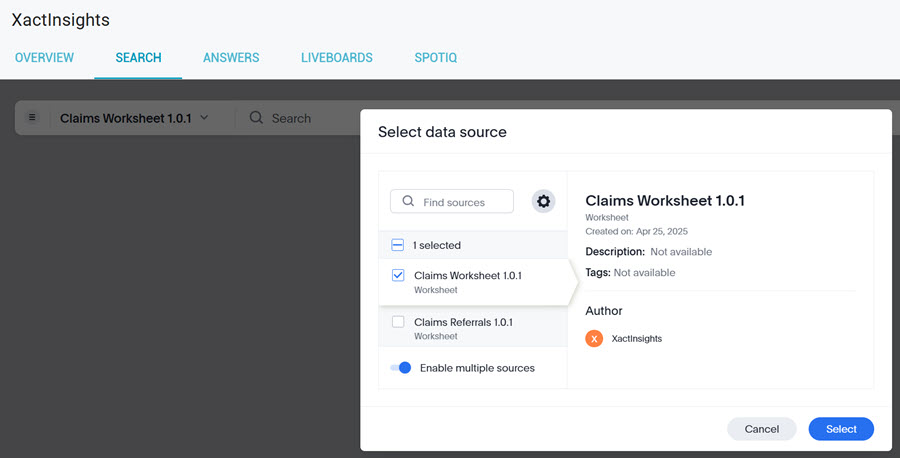
- Select the data source menu to the left of the Search bar. The Select data source pop-up window appears.
- Select data sources from the scrolling list, or search for a specific data source in the search bar.
- Select the Settings icon to filter data sources by types and tags.
- Toggle the Enable multiple sources option to select multiple data sources, or turn it off to select only one data source.
- Click Select when you are done.
Data panel
The data panel on the left has three tabs with different ways to view columns:
- The left tab lists the most popular columns within a certain worksheet.
- The center tab groups columns by measures, attributes, or dates.
- The right tab lists columns alphabetically.
Within each of these views, the columns are still organized by the worksheet they belong to.
Using XactInsights Search
Select the columns that you want to include in your search. You can either select columns from the data panel, or you can type the column names directly into the search bar.
Once all your chosen columns are in the search bar, do one of the following to complete the search:
- Select Go.
- Select the gray space beneath the search bar.
- Press the Enter key on your keyboard.
XactInsights automatically generates a chart to visualize your data. You can change it to a table by selecting the table icon or change it back to a chart by selecting the chart icon.
Sharing data
To share your Answer with another user, follow these steps:
- Select the share icon.
- Add a description, if desired.
- Select Save answer.
- Write your name in the Display name field.
- Select Save.
- Enter the name of the user or group you want to send the Answer to.
- Select Share.
Related articles: XactInsights overview, Worksheets and columns, Keywords