Graphical Management Reports
 Updated
by
Arianne G.
Updated
by
Arianne G.
- Code Upgrade by Category
- Corrosion Mitigation
- Corrosion Mitigation Opportunity
- Estimate Collaboration Reasons
- Estimate Depreciation Usage
- Estimate Flooring Usage
- Estimate Inclusion Issues
- Estimate Items by Quality
- Estimate Minimum/Base Service Charge Usage
- Estimate NFCP Usage
- Estimate Overhead and Profit
- Estimate Roofing Usage
- Estimate Scoping Overlap
- Estimate Siding Usage
- Estimate Tax Usage
- Estimate Type of Loss
- Estimate/Price List Differences
- Estimate/Price List Differences for Contents
- Labor Efficiency Usage
The following Graphical management reports are available in XactAnalysis®, depending on your company’s settings and your rights. See Management/Activity Reports for help with generating reports.
For most reports, select a bar in the graph, a row heading in the table, or a geographic/organizational area in the hierarchy tree to see data for other levels of your hierarchy.
Code Upgrade by Category
When developing an estimate for an older home, sometimes additional work or materials may be required to bring the home up to current building codes. Code Upgrade refers to line items that had to be added to an estimate to bring a building up to code. This report displays the additional costs associated with estimates that require code upgrades.
Code Upgrade Value by Category graph
This bar graph displays the average cost of a code upgrade by Xactimate pricing categories. Hover over the bars to see the total code upgrade cost per pricing category.
Code Upgrade Value by Category table
Columns
Code Upgrade Estimates: Number of estimates that require a code upgrade in each pricing category
Estimates: Number of estimates that have line items in each pricing category
Code Upgrade Line Items: Number of line items in each pricing category that are a result of a code upgrade
Avg Code Upgrade Items per Estimate: Average number of code-upgrade line items per estimate that requires a code upgrade (Code Upgrade Line Items / Code Upgrade Estimates)
Category Distribution %: Percent of code-upgrade line items in each category that has code upgrades (Code Upgrade Line Items / # of Pricing Categories Shown)
Total Code Upgrade Estimate Value: Total value of estimates that require a code upgrade in each pricing category, including the cost of the code upgrade
Total Original Estimate Value: Total original value of estimates that require a code upgrade in each pricing category, excluding the cost of the code upgrade
Total Difference: Added costs to estimates in each pricing category because of a code upgrade (Total Code Upgrade Estimate Value - Total Original Estimate Value)
Avg Difference: Average costs difference for estimates that require a code upgrade in each pricing category (Total Difference / Code Upgrade Estimates)
Avg Code Upgrade Estimate Value: Average estimate value of estimates that require a code upgrade in each pricing category (Total Code Upgrade Estimate Value / Code Upgrade Estimates)
Frequency of Code Upgrade %: Percent of estimates in each pricing category that require a code upgrade (Code Upgrade Estimates / Estimates • 100)
Rows
Specific pricing categories (like Doors, Drywall, Floor Covering – Carpet, Roofing, etc) (Pricing categories are only shown if it contains a code-upgrade line item)
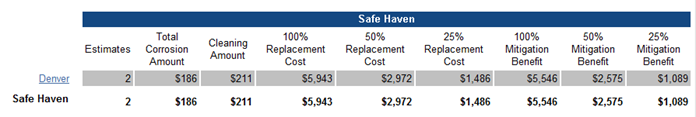
Corrosion Mitigation
This report displays the cost of pre-cleaning and cleaning smoke or fire damaged items and the cost of replacing the items. It also shows the value saved by pre-cleaning and cleaning versus replacing the items. Only Fire, Smoke, and Soot loss type estimates are shown. This report helps you track the difference between the cost of mitigation and the cost of replacement for smoke or fire damaged items.
- Select a bar in the graph or a geographic/organizational area link in the table to see data for other levels of your hierarchy, including individual estimates.
- Hover over bars in the graph to see the number of estimates.
Corrosion Mitigation graph
This graph displays the total value saved by using mitigation.
Corrosion Mitigation table
Columns
Estimates: Number of estimates with corrosion mitigation
Total Corrosion Amount: Cost of corrosion damages
Cleaning Amount: Cost to clean damaged items
100% Replacement Cost: Total cost to replace damaged items
50% Replacement Cost: Half of the cost to replace damaged items
25% Replacement Cost: One-quarter of the cost to replace damaged items
100% Mitigation Benefit: Total value saved by using mitigation
50% Mitigation Benefit: Half of the value saved by using mitigation
25% Mitigation Benefit: One-quarter of the value saved by using mitigation
Rows
Geographic/organizational areas
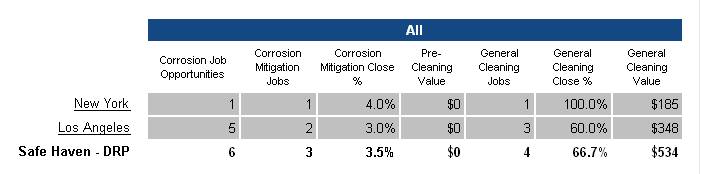
Corrosion Mitigation Opportunity
This report displays the number of fire/smoke/soot claims and compares that to the number of estimates that used pre-cleaning items, helping you monitor the frequency of corrosion mitigation use.
- Select a bar in the graph or a geographic/organizational area link in the table to see data for other levels of your hierarchy, including individual estimates.
Corrosion Mitigation Close Percentage graph
This graph displays the pre-cleaning close percentage (the percentage of estimates that used pre-cleaning).
General Cleaning Close Percentage graph
This graph displays the general cleaning close percentage (the percentage of estimates that used general cleaning).
Corrosion Mitigation Opportunity table
Columns
Corrosion Mitigation Job Opportunities: Number of estimates with 'Fire', 'Smoke' or 'Soot' loss type
Corrosion Mitigation Jobs: Number of estimates with Pre-Cleaning items
Corrosion Mitigation Close Percentage: The percentage of estimates that used pre-cleaning
General Cleaning Jobs: Number of estimates with CLN as a selector in line items
General Cleaning Close Percentage: The percentage of estimates that used general cleaning
General Cleaning Value: Total cleaning value
Rows
Geographic/organizational areas
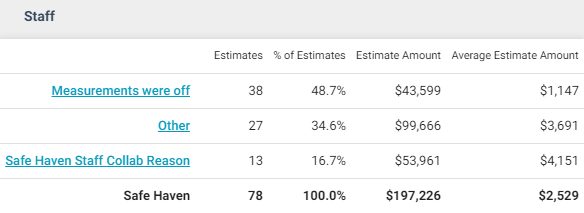
Estimate Collaboration Reasons
This report displays collaborated estimate data by reason for collaboration, helping you track reasons estimates are collaborated.
- Select a bar in the graph or a row heading in the table to see data for levels of your hierarchy, including individual estimates.
- Hover over bars in the graph to see the estimate total dollar amount.
Estimate Collaboration Reasons graph
This graph displays the percentage of collaborated estimates included under each reason.

Estimate Collaboration Reasons table
Columns
Estimates: Number of estimates
% of Estimates: Percentage of estimates
Estimate Amount: Estimate dollar amount
Average Estimate Amount: Average estimate dollar amount (Estimate Amount / Estimates)
Rows
Collaboration reasons
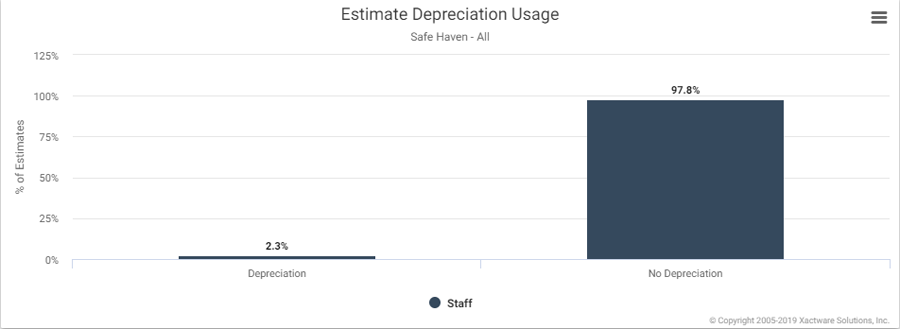
Estimate Depreciation Usage
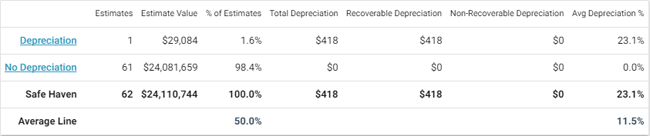
This report displays the percentage and number of estimates that had either depreciation or no depreciation applied to line items in Xactimate®, helping you observe how depreciation affects the value of estimates.
- Select a bar in the graph or a row heading in the table to see data for levels of your hierarchy, including individual estimates.
- Hover over bars in the graph to see the number of estimates.
Estimate Depreciation Usage graph
This graph displays the percentages of all estimates with or without depreciation applied to line items.
Estimate Depreciation Usage table
Columns
Estimates: Number of estimates
Estimate Value: Total estimate value
% of Estimates: Percentage of total estimates
Total Depreciation: Value of total depreciation applied
Recoverable Depreciation: Depreciation value of all recoverable items
Non-Recoverable Depreciation: Depreciation value of all non-recoverable items (Total Depreciation - Recoverable Depreciation)
Avg Depreciation %: Average line item depreciation percentage. Click here for more details.
Rows
Depreciation: Estimates with depreciation applied
No Depreciation: Estimates with no depreciation applied
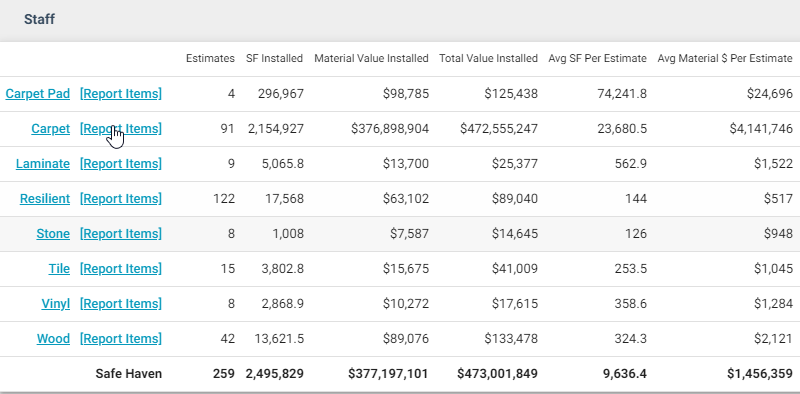
Estimate Flooring Usage
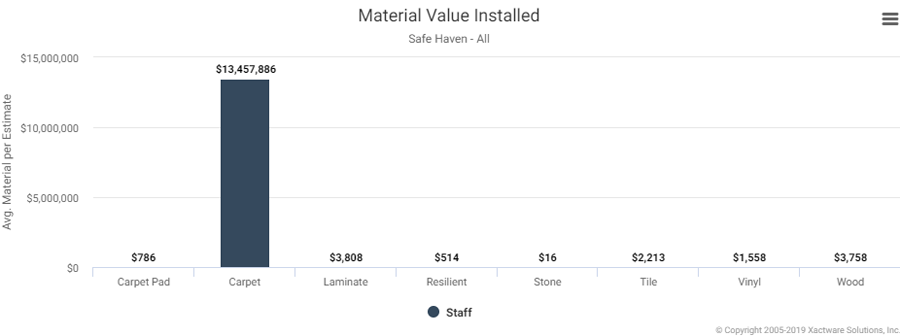
This report displays material quantities and line item totals per estimate for the seven flooring categories used in Xactimate: Carpet, Carpet Pad, Resilient, Stone, Tile, Vinyl, and Wood. This report helps you see which types of flooring items are most used.
- Select a bar in the graph(s) or a flooring category in the table(s) to see data for other levels of your hierarchy, including individual estimates.
Material Value Installed graph
This graph displays the average material value installed per estimate for each flooring category.
- Hover over bars to see the total material value installed.
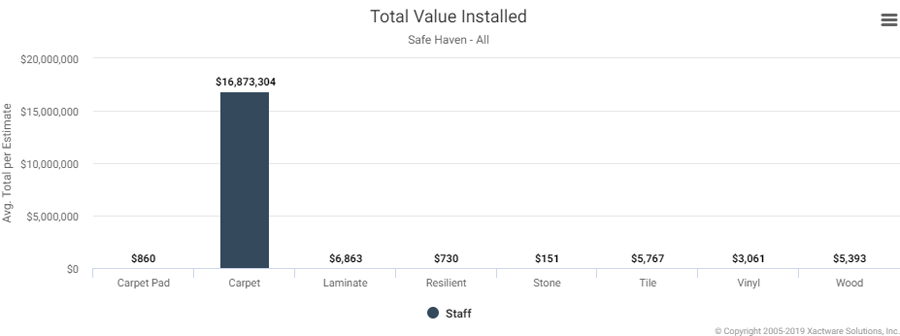
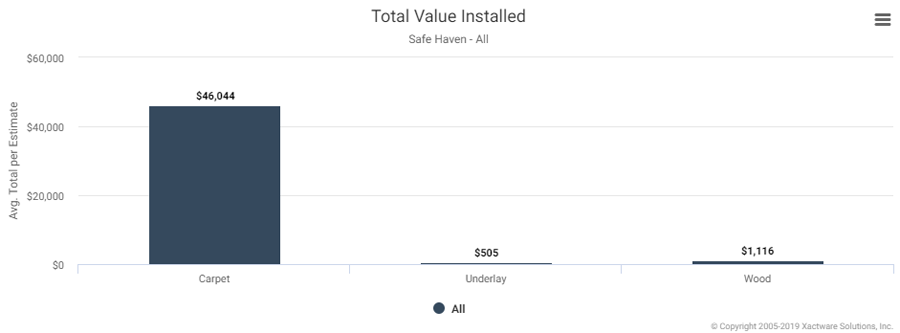
Total Value Installed graph
This graph displays the average total value installed for each flooring category per estimate. The total flooring value comprises material, labor, and equipment cost.
- Hover over bars to see the total value installed.
Estimate Flooring Usage table
Columns
Estimates: Number of estimates
SF Installed: Square feet of flooring material installed
Material Value Installed: Total dollar value of flooring material installed
Total Value Installed: Total dollar value of flooring line items, including material, labor, and equipment
Avg SFPer Estimate: Average square feet of material installed per estimate (SF Installed / Estimates)
Avg Material $ Per Estimate: Average flooring material cost per estimate (Material Value Installed / Estimates)
Avg Total $ Per Estimate: Average total flooring cost per estimate (Total Value Installed / Estimates)
Avg Material $ Per SF: Average flooring material cost per square foot (Material Value Installed / SF Installed)
Avg Total $ Per SF: Average total flooring cost per square foot (Total Value Installed / SF Installed)
Avg Estimate Value: Average estimate value
% NFCP Estimates: Percentage of estimates that used a National Floor Covering Program (NFCP). When an estimate uses an NFCP, samples of flooring are sent to a third-party vendor who sends back information about the flooring’s make and grade so the adjuster or contractor can install an exact match or arrive at an exact price.
% Non-NFCP Estimates: Percentage of estimates that did not use an NFCP
Rows
Flooring categories (like Carpet, Carpet Pad, Stone, Tile, Wood, etc)
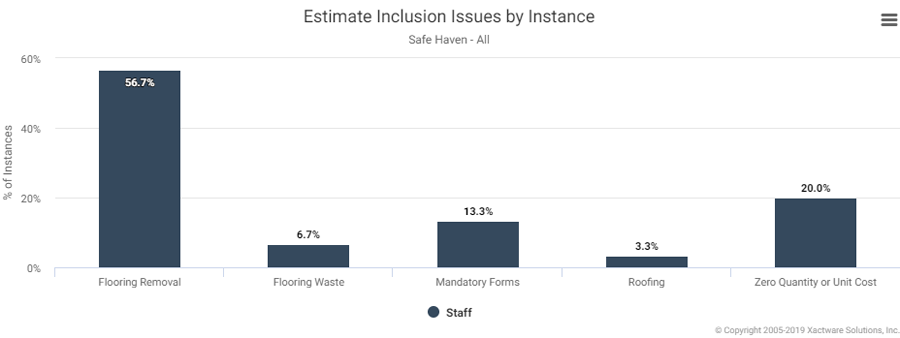
Estimate Inclusion Issues
This report displays the percentage and number of instances in which work may have been duplicated on estimates. It does this by detecting combinations of item codes that involve duplication. For instance, a line item (e.g. a new sink) may have been included twice on the estimate, when it was intended to be included once. This report helps you track and address estimate errors, ultimately reducing costs due to waste and error.
- Select a bar in the graph or a flooring category in the table to see data for other levels of your hierarchy, including individual estimates and specific line items that violated a rule.
Estimate Inclusion Issues by Instance graph
This graph displays each inclusion issue type found in estimates and the percentage of issues each type had.
- Hover over the bars to see the number of instances.
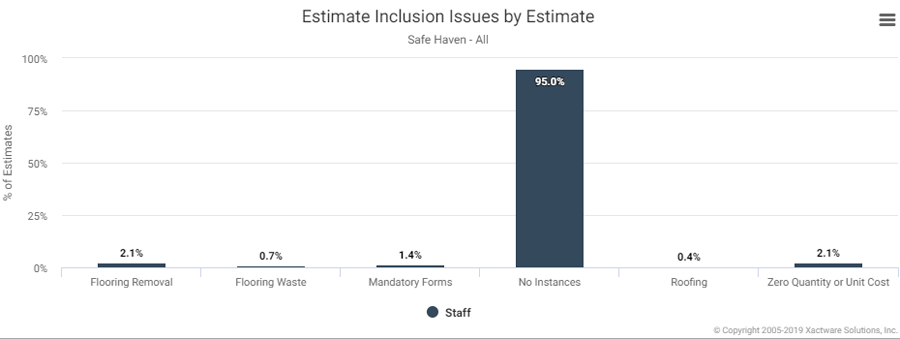
Estimate Inclusion Issues by Estimate graph
This graph displays each inclusion issue type found in estimates and the percentage of estimates with the identified issues.
- Hover over the bars to see the number of estimates.
Estimate Inclusion Issues table
Columns
Instances: Number of inclusion issue instances
Estimates: Number of estimates
Avg Instances per Estimate: Average number of inclusion issue instances found per estimate (Instances / Estimates)
% of Instances: Percentage of total instances
% of Estimates: Percentage of total estimates
Rows
Inclusion issue categories (like Doors, Drywall, Floor Covering – Carpet, Roofing, etc) (Pricing categories are only shown if it contains an inclusion issue)

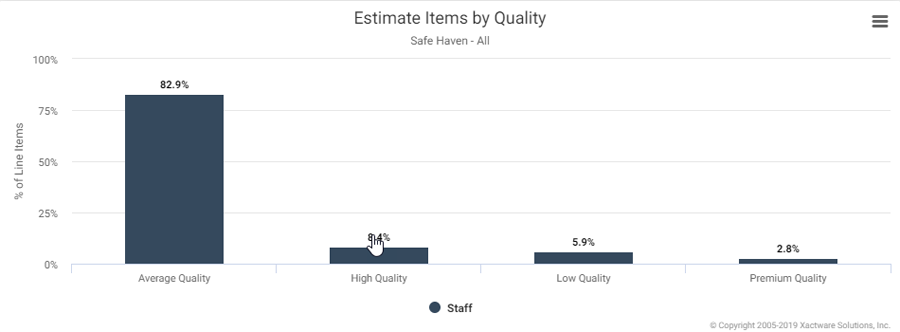
Estimate Items by Quality
This report displays the percentage and number of estimate items (line items) separated into the four Xactimate category grades (low, average, high, and premium). This helps you see the item quality in a given set of estimates.
- Select a bar in the graph or a category grade in the table to see data for other levels of your hierarchy, including individual estimates.
- Hover over bars in the graph to see the number of line items.
Estimate Items by Quality graph
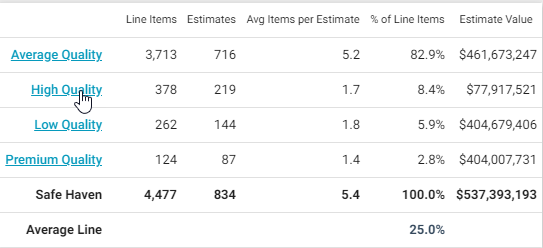
The graph displays the percentage of line items that were used for each category grade.
Estimate Items by Quality table
Columns
Line Items: Number of line items
Estimates: Number of estimates
Avg Items per Estimate: Average number of category grade line items per estimate (Line Items / Estimates)
% of Line Items: Percentage of total line items
Estimate Value: Value of estimates
Rows
Category grades (Average Quality, High Quality, Low Quality, and Premium Quality)
Estimate Minimum/Base Service Charge Usage
This report displays labor minimum and base service charge usage data.
A labor minimum is a dollar amount an adjuster or contractor may charge for showing up to do a job. If the actual estimate ends up being less than the labor minimum, Xactimate adds the necessary dollar amount to increase the estimate to the labor minimum amount required by the adjuster or contractor. This is the labor minimum adjustment.
A base service charge is a dollar amount an adjuster or contractor may charge for showing up to do a job. Xactimate simply adds this dollar amount to the estimate (based on the selected labor efficiency usage) to cover the charge.
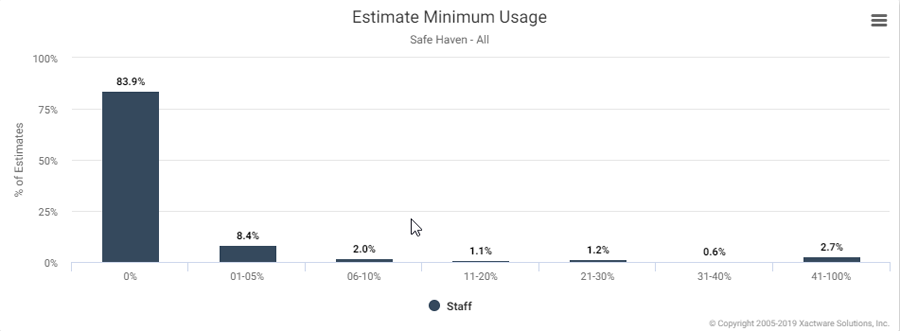
Estimate Minimum Usage graph
The x-axis (horizontal line) shows a series of percentage ranges. These ranges represent the percentage of estimate value that consists of labor minimum adjustments or base service charges.
The y-axis (vertical line) shows the percentage of total estimates that fall under each range.
For example, in the graph below, 3.3% of all the estimates had base service charges and labor minimum adjustments that accounted for 6-10% of the total estimate dollar amount.
- Select a bar in the graph to see data for other levels of your hierarchy, including individual estimates.
- Hover over bars to see the number of estimates.
Estimate Minimum Usage table
Columns
Estimates: Number of total estimates
% of Estimates: Percentage of total estimates
Estimate Value: Total value of estimates
Total Minimum $: Total value of labor minimum adjustments and base service charges
Average Minimum $: Average value of labor minimum adjustments and base service charges
Rows
Ranges representing the percentage of estimate value consisting of labor minimum adjustments or base service charges.
- Select a range to see data for other levels of your hierarchy, including individual estimates.

Estimate NFCP Usage
This report displays the percentage and number of estimates containing flooring items where the National Floor Covering Program (NFCP) was used and where the NFCP was not used. When an estimate uses the NFCP, samples of flooring are sent to ITELSM (a third-party vendor) who sends back information about the flooring’s make and grade so the adjuster or contractor can install an exact match or arrive at an exact price. This report helps you see how extensively this third-party service is used.
- Select a bar in the graph or a link in the table to see data for other levels of your hierarchy, including individual estimates.
- Hover over bars in the graph to see the number of estimates.
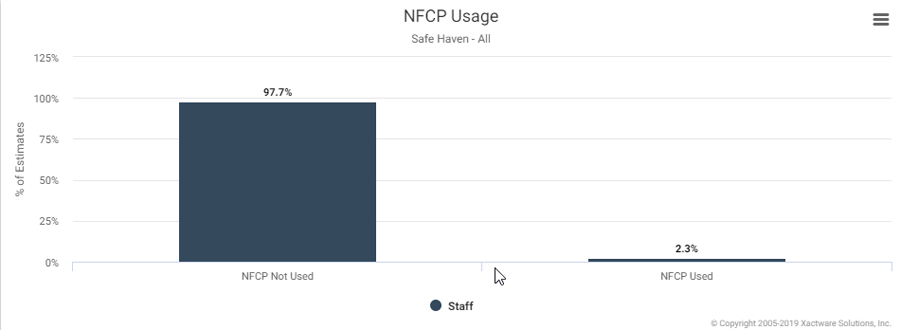
NFCP Usage graph
This graph displays the percentage of estimates where NFCP was used and where NFCP was not used.
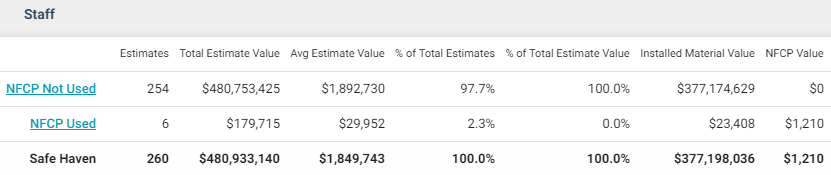
Estimate NFCP Usage table
Columns
Estimates: Number of estimates
Total Estimate Value: Total value of estimates
Avg Estimate Value: Average estimate value (Total Estimate Value / Estimates)
% of Total Estimates: Percentage of total estimates
% of Total Estimate Value: Percentage of total estimate value
Installed Material Value: Installed material value
NFCP Value: NFCP value
Avg Quality Value (for NFCP Items): Average quality value for NFCP items
Rows
NFCP Not Used and NFCP Used categories
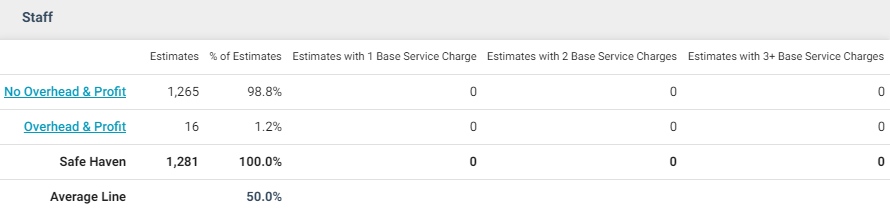
Estimate Overhead and Profit
This report displays the percentage and number of estimates in which overhead and profit were or were not applied. Overhead is the percentage an adjuster or contractor is allowed to mark up an estimate to cover overhead expenses, such as driving to the job and office costs. Profit is the percentage the adjuster or contractor is allowed to mark up the estimate to ensure a profit. Adjusters or contractors are typically limited to a 10% markup for both overhead and profit.
- Select a bar in the graph or a link in the table to see data for other levels of your hierarchy, including individual estimates.
- Hover over bars in the graph to see the number of estimates.
Estimate Overhead and Profit Usage graph
This graph displays the percentage of estimates that have or do not have overhead and profit.

Estimate Overhead and Profit table
Columns
Estimates: Number of estimates
% of Estimates: Percentage of total estimates that have or do not have O&P
Estimates with 1 Base Service Charge: Number of estimates with one base service charge
Estimates with 2 Base Service Charges: Number of estimates with two base service charges
Estimates with 3+ Base Service Charges: Number of estimates with three or more base service charges
Rows
No Overhead & Profit
Overhead & Profit
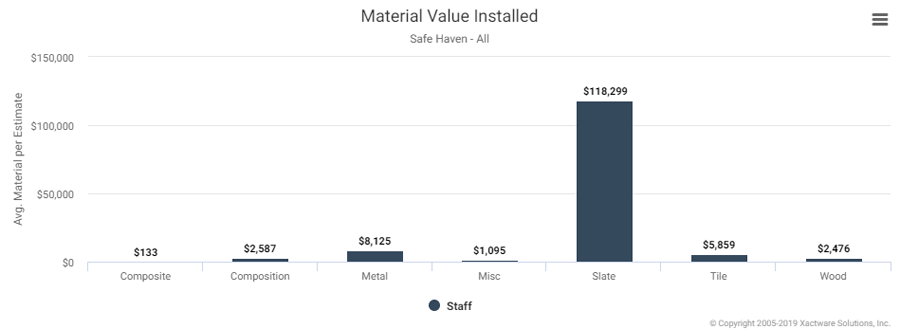
Estimate Roofing Usage
This report displays estimate material quantities and line item totals for the nine roofing categories used in Xactimate: Built Up, Composite, Composition, Membrane, Metal, Slate, Tile, Wood, and Miscellaneous. This report helps you see which types of roofing items are most used.
- Select a bar in the graph or a roofing category in the table to see data for other levels of your hierarchy, including individual estimates.
Material Value Installed graph
This graph displays the average dollar amount of roofing material used per estimate, by roofing category.
- Hover over the bars to see the total dollar amount of roofing material estimated.
Total Value Installed graph
This graph displays the average total roofing value installed for each roofing category per estimate. The total roofing value installed includes material, labor, and equipment.
- Hover over the bars to see the total value installed.

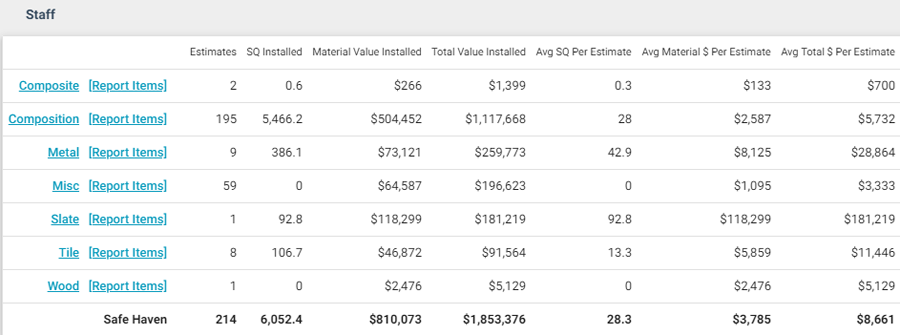
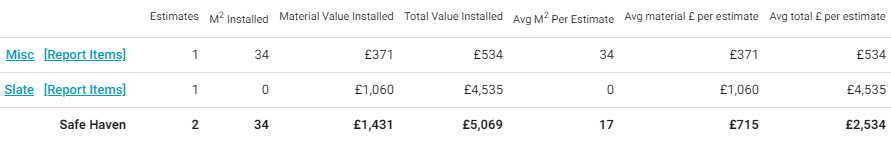
Estimate Roofing Usage table
Columns
Estimates: Number of estimates with roofing
SQ Installed: Squares of roofing material installed
Material Value Installed: Value of estimated roofing material
Total Value Installed: Total Value of roofing line items, including material, labor, and equipment
Avg SQ Per Estimate: Average number of squares installed per estimate (SQ Installed / Estimates)
Avg Material $ Per Estimate: Average roofing material cost per estimate (Material Value Installed / Estimates)
Avg Total $ Per Estimate: Average total roofing cost per estimate (Total Value Installed / Estimates)
Avg Material $ Per SQ: Average roofing material cost per square (Material Value Installed / SQ Installed)
Avg Total $ Per SQ: Average total roofing cost per square (Total Value Installed / SQ Installed)
Avg Estimate Value: Average estimate value
Rows
Roofing categories (like built-up, composite, composition, membrane, metal, slate, tile, wood, etc)
- Click [Report Items] to see the report details for each line item in the category.
Estimate Scoping Overlap
This report displays the percentage and number of possible quantity calculation errors in estimates. It does this by checking for instances in which the quantity specified for a line item exceeds the maximum or usual maximum quantity for such an item in the room. This report helps you track and address estimate errors.
- Select a bar in the graph or an instance category in the table to see data for other levels of your hierarchy, including individual estimates and specific line items that violated a rule.
Estimate Scoping Overlap by Instance graph
This graph displays the percentage of scoping instances by instance category.
- Hover over the bars to see the number of instances.

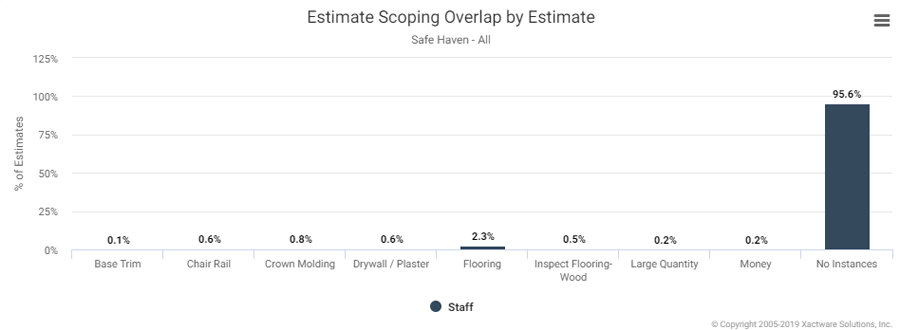
Estimate Scoping Overlap by Estimate graph
This graph displays the percentage of estimates with scoping instances by instance category.
- Hover over the bars to see the number of estimates.
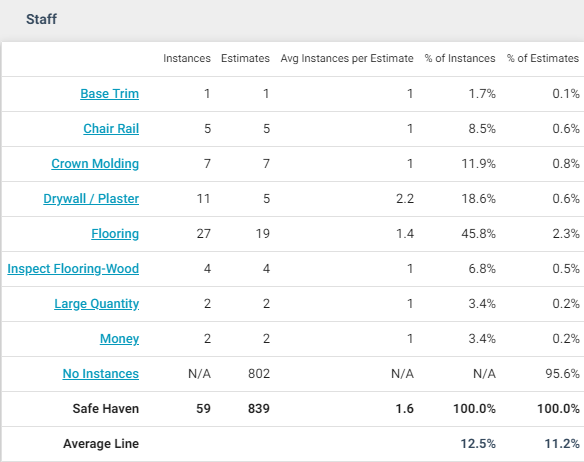
Estimate Scoping Overlap table
Columns
Instances: Number of instances
Estimates: Number of estimates with overlap issues
Avg Instances per Estimate: Average number of instances per estimate (Instances / Estimates)
% of Instances: Percentage of total instances
% of Estimates: Percentage of total estimates
Rows
Instance categories (like Doors, Drywall, Floor Covering – Carpet, Roofing, etc) (Instance categories are only shown if it contains a line item that exceeds the maximum or usual maximum quantity for such an item in the room)
Estimate Siding Usage
This report displays material quantities and line item totals for the four siding categories used in Xactimate: Metal, Vinyl, Wood, and Miscellaneous. This report helps you track the types of siding items used most frequently.
- Select a bar in the graph or a siding category in the table to see data for other levels of your hierarchy, including individual estimates.
Material Value Installed graph
This graph displays the average cost of siding material used per estimate, by siding category.
- Hover over the bars to see the total material value installed.

Total Value Installed graph
This graph displays the average total siding value installed for each siding category per estimate. The total siding value installed includes material, labor, and equipment.
- Hover over the bars to see the total value installed.

Estimate Siding Usage table
Columns
Estimates: Number of estimates with siding
SF Installed: Square feet of siding material installed
Material Value Installed: Value of installed siding material
Total Value Installed: Total dollar value of siding line items, including material, labor, and equipment
Avg SF Per Estimate: Average square feet installed per estimate (SF Installed / Estimates)
Avg Material $ Per Estimate: Average siding material cost per estimate (Material Value Installed / Estimates)
Avg Total $ Per Estimate: Average total siding cost per estimate (Total Value Installed / Estimates)
Avg Material $ Per SF: Average siding material cost per square foot (Material Value Installed / SF Installed)
Avg Total $ Per SF: Average total siding cost per square foot (Total Value Installed / SF Installed)
Avg Estimate Value: Average estimate value
Rows
Roofing categories (Select [Report Items] to see the estimate line items.)

Estimate Tax Usage
This report displays the number and percentage of estimates with tax, material sales tax, equipment tax, labor tax, flat tax, other tax, and any combination of these taxes.
- Select a bar in the graph or a tax category in the table to see data for other levels of your hierarchy, including individual estimates.
- Hover over bars in the graph to see the number of estimates.
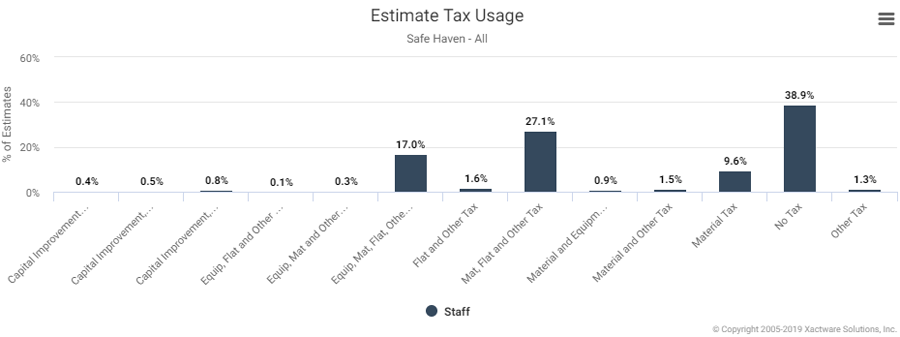
Estimate Tax Usage graph
This graph displays the percentage of estimates that fall under each tax category.
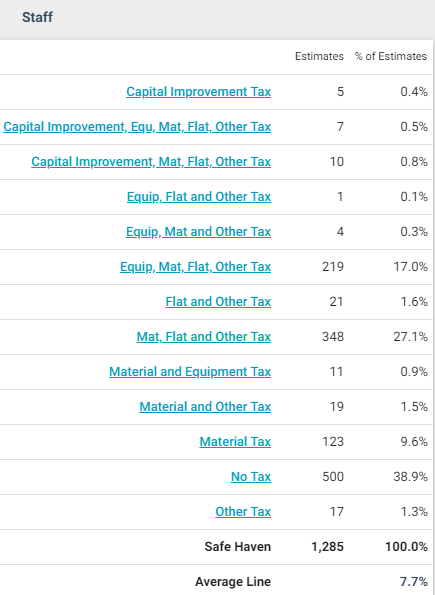
Estimate Tax Usage table
Columns
Estimates: Number of estimates
% of Estimates: Percentage of total estimates
Rows
Tax categories
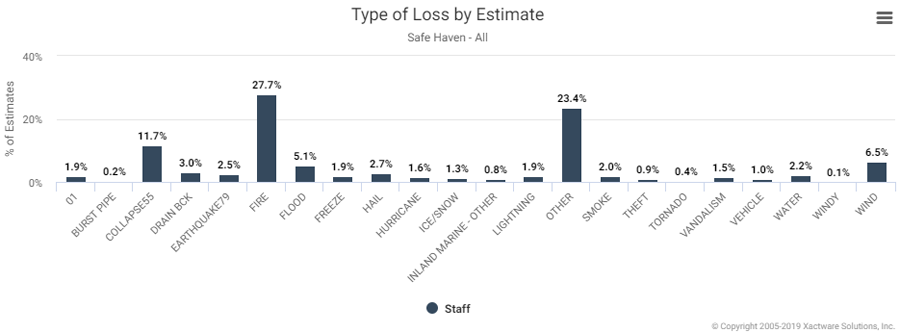
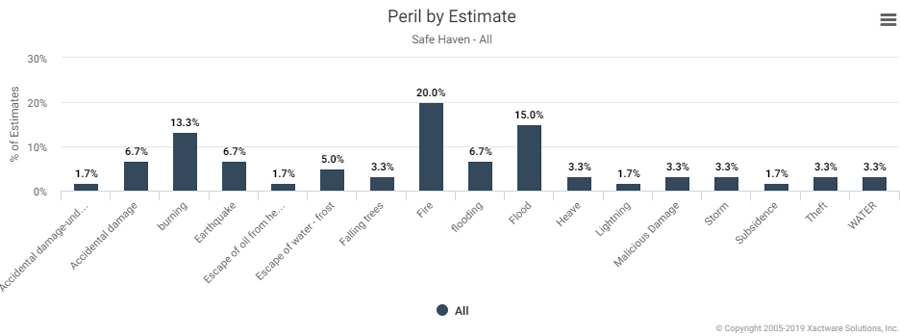
Estimate Type of Loss
This report displays the percentage, value, and number of estimates by type of loss. This report helps you track which types of loss are most frequent and infrequent, which often varies by locality.
- Select a bar in the graph or a type of loss in the table to see data for other levels of your hierarchy, including individual estimates.
Type of Loss by Estimate graph
This graph displays the percentage of estimates per type of loss.
- Hover over the bars to see the number of estimates.
Type of Loss by Estimate Value graph
This graph displays the percentage value of all estimates per type of loss.
- Hover over the bars to see the estimate value.

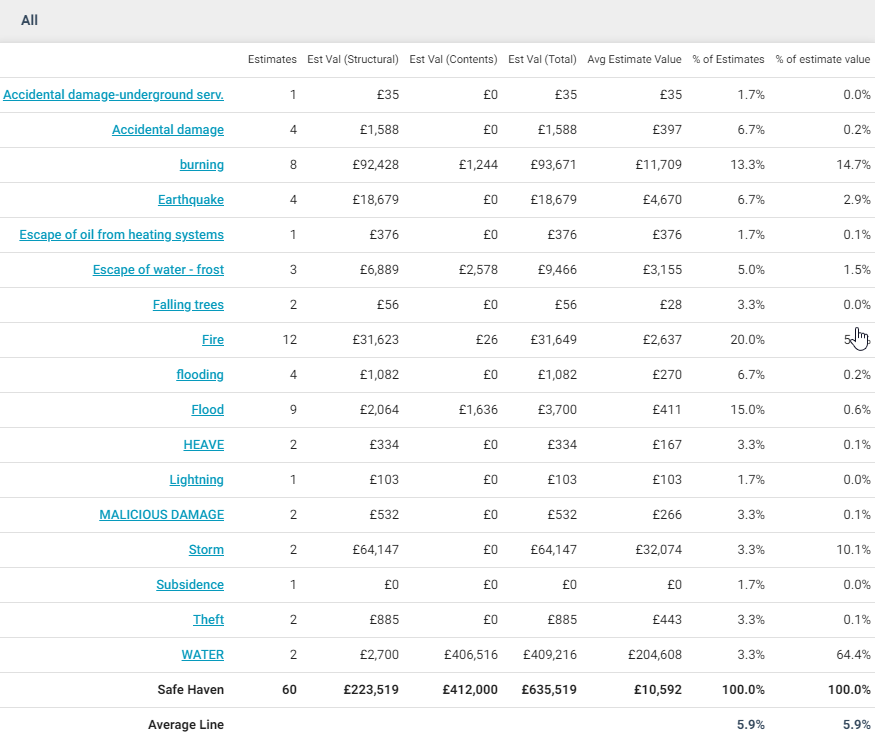
Estimate Type of Loss table
Columns
Estimates: Number of estimates
Estimate Value: Total estimate value
Avg Estimate Value: Average estimate value (Estimate Value / Estimates)
% of Estimates: Percentage of total estimates
% of Estimate Value: Percentage of total estimate value
Rows
Type of Loss categories

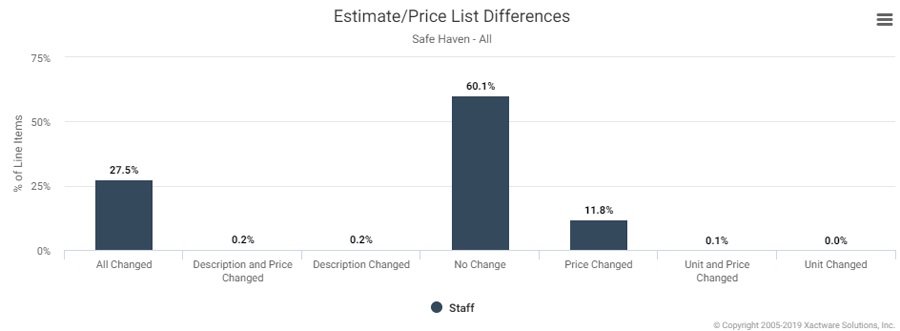
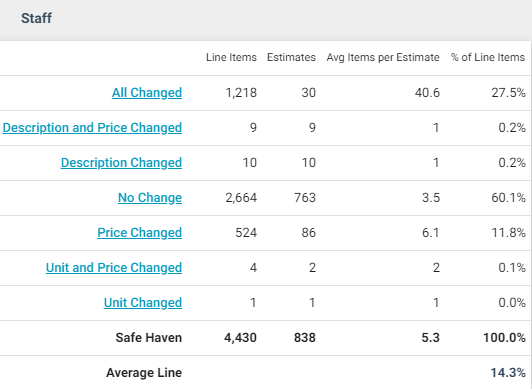
Estimate/Price List Differences
This report displays the percentage and number of price list line items that changed in Xactimate during the estimating process, thereby deviating from the checkpoint price list. It shows changes in unit of measure, description, price, and all combinations of these categories. All Changed includes line items that are not in the price list.
- Select a bar in the graph or a price list difference category in the table to see data for other levels of your hierarchy, including individual estimates.
- Hover over bars in the graph to see the number of line items.
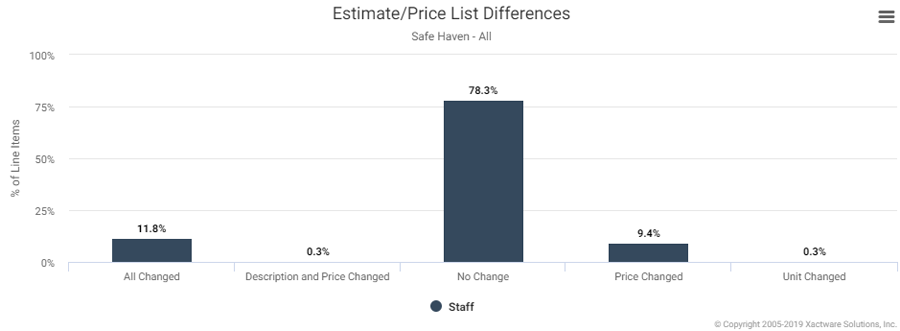
Estimate/Price List Differences graph
This graph displays the percentage of line items that changed, by price list differences category.
Estimate/Price List Differences table
Columns
Line Items: Number of line items
Estimates: Number of estimates
Avg Items per Estimate: Average number of line items per estimate (Line Items / Estimates)
% of Line Items: Percentage of total line items
Rows
All Changed: Estimates with at least one line item description, price, and unit change
Description Changed: Estimates with at least one line item description change
Description and Price Changed: Estimates with at least one line item description and price change
Description and Unit Changed: Estimates with at least one line item description and unit change
No Change: Estimates with no change
Price Changed: Estimates with at least one line item price change
Unit Changed: Estimates with at least one line item unit change
Unit and Price Changed: Estimates with at least one line item unit and price change
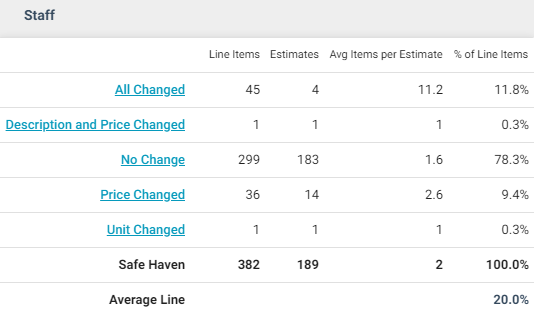
Estimate/Price List Differences for Contents
This report displays the percentage and number of contents line items that changed in Xactimate during the estimating process, thereby deviating from the checkpoint pricelist. It shows changes in unit of measure, description, price, and all combinations of these changes (including No Change). All Changed includes line items that are not in the price list.
- Select a bar in the graph or a price list difference category in the table to see data for other levels of your hierarchy, including individual estimates.
- Hover over bars in the graph to see the number of line items.
Estimate/Price List Differences graph
This graph displays the percentage of contents line items that changed, by price list differences category.
Estimate/Price List Differences for Contents table
Columns
Line Items: Number of line items
Estimates: Number of estimates
Avg Items per Estimate: Average number of line items per estimate (Line Items / Estimates)
% of Line Items: Percentage of total line items
Rows
All Changed: Estimates with at least one line item description, price, and unit change
Description Changed: Estimates with at least one line item description change
Description and Price Changed: Estimates with at least one line item description and price change
No Change: Estimates with no change
Price Changed: Estimates with a line item price change
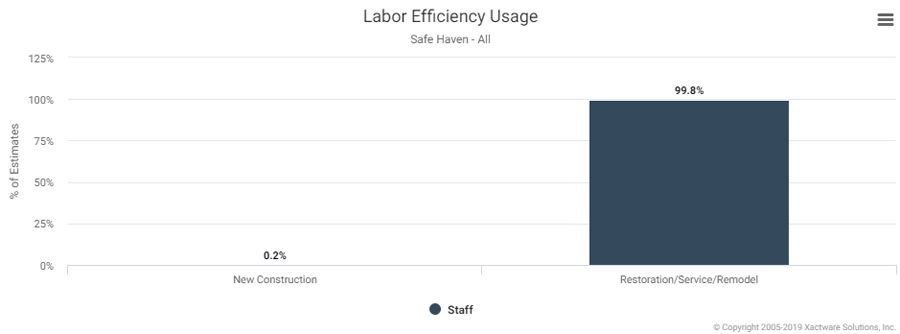
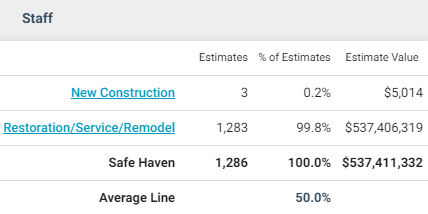
Labor Efficiency Usage
This report displays the number and percentage of estimates using the labor efficiency types—New Construction and Restoration/Service/Remodel. New Construction labor efficiency type estimates are typically lower because demolition, clean up, etc. are not required, while Restoration/Service/Remodel labor efficiency type estimates are typically higher. Labor efficiencies determine how base service charges are added in Xactimate. When Restoration/Service/Remodel is used, base service charges can be Broken Out, Factored In, or Not Applied.
- Select the Restoration/Service/Remodel bar or link in the first graph or table to see data for Broken Out, Factored In, No Labor Efficiencies, and Not Applied.
- Select other bars in the graph or labor efficiency types in the table to see data for other levels of your hierarchy, including adjuster or contractor and estimate.
Labor Efficiency Usage graph - Level 1
This graph displays the percentage of estimates by labor efficiency type.
- Hover over the bars to see the number of estimates.
Labor Efficiency Usage table - Level 1
Columns
Estimates: Number of estimates
% of Estimates: Percentage of total estimates
Estimate Value: Estimate value
Rows
Labor Efficiency Types
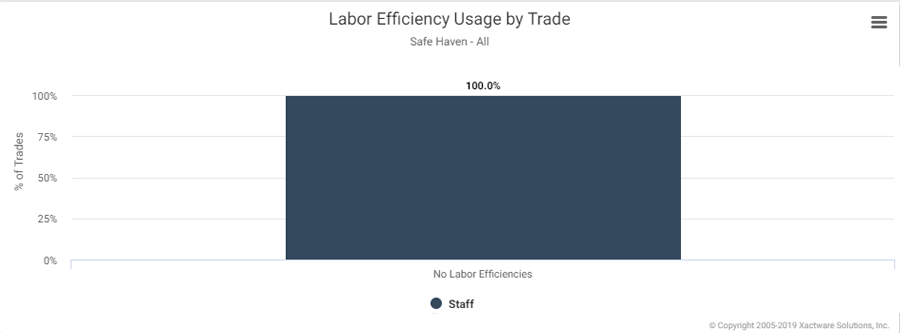
Labor Efficiency Usage graphs - Level 2
If the Restoration/Service/Remodel link is selected, two graphs appear. The first graph displays the percentage of estimates by base service charge, and the second graph displays the percentage of trades by base service charge. If a different labor efficiency is selected on the first level, a graph appears displaying data for the next level of your hierarchy.
- Hover over the bars to see the number of estimates.
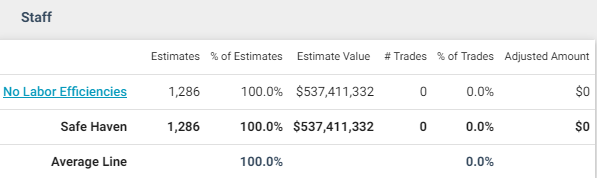
Labor Efficiency Usage table - Level 2
Columns
Estimates: Number of estimates
% of Estimates: Percentage of total estimates
Estimate Value: Estimate value
# Trades: Number of trades
% of Trades: Percentage of total trades
Adjusted Amount: Dollar amount added by using base service charges
Rows
Broken Out: Information for estimates with base service charges not included in the price of each line item
Factored In: Information for estimates with base service charges included in the price of each line item
No Labor Efficiencies: Information for estimates (set up for the Restoration/Service/Remodel labor efficiency) with no base service charges in the estimate. For example, this can happen if the adjuster uses all MISC items to write an estimate resulting in no trades. The # Trades column in the report will show zeros for this category.
Not Applied: Information for estimates (set up for base service charges) with no base service charges applied
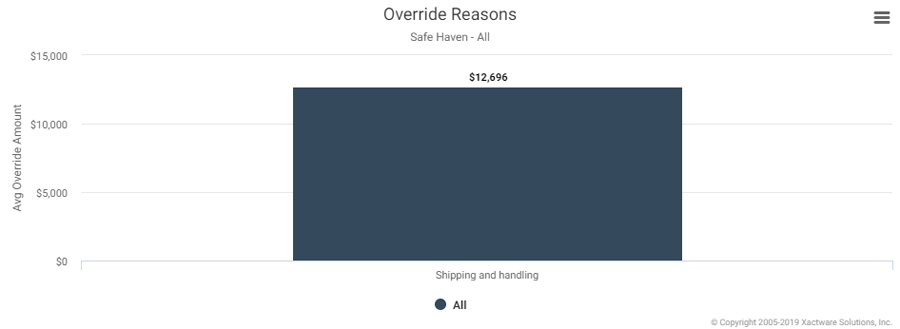
Payment Tracker Override Reasons
This report displays the number and value of contents coverage estimate overrides by override reason (as entered in the XactContents Payment Tracker). This report helps you track reasons for overrides.
- Select a bar in the graph or an override reason in the table to see data for other levels of your hierarchy, including individual estimates.
Override Reasons - Graph 1
This graph displays the average override dollar amount by override reason.
- Hover over the bars to see the total dollar amount.

Override Reasons - Graph 2
This graph displays the total override dollar amount by override reason.
- Hover over the bars to see the average dollar amount.
Override Reasons table
Columns
Number of Overrides: Number of Overrides
Total $ Value for Overrides: Total dollar value for overrides
Avg $ Value for Overrides: Average dollar value for overrides (Total $ Value for Overrides / Number of Overrides)
Avg $ Estimate Value: Average dollar value of estimates
Total Estimate Value: Total dollar value of estimates
Rows
Override reasons (as entered in the XactContents Payment Tracker)

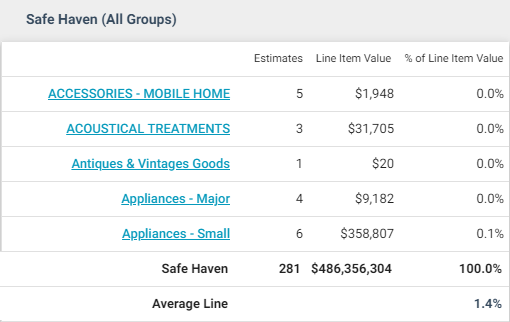
Percentage Breakdown of Estimate by Department
This report displays the percentage each contents department contributed to the selected estimates’ total line item value, helping you track the types of line items used most frequently.
- Select a bar in the graph or a line item category in the table to see data for other levels of your hierarchy, including individual estimates.
- Hover over bars in the graph to see the line item value.
Percentage Breakdown of Estimate by Department graph
This graph displays each contents department’s percentage of estimates’ total line item value.

Percentage Breakdown of Estimate by Department table
Columns
Estimates: Number of estimates
Line items Value: Value of line items
% of Line Items Value: Percentage of total line items value
Rows
Contents departments
Percentage Breakdown of Estimate by Trade
This report displays the percentage and value the line items from each trade (for example, Carpenter, Plumber, etc.) contribute to the total estimate dollar value, helping you track the trades used most frequently.
- Select a bar in the graph or a trade category in the table to see data for other levels of your hierarchy, including individual estimates.
- Hover over bars in the graph to see the line item value.
Percentage Breakdown of Estimate by Trade graph
This graph displays each trade’s percentage of total estimate line item value.

Percentage Breakdown of Estimate by Trade table
Columns
Estimates: Number of estimates
Line Items Value: Value of line items
% of Line Items Value: Percentage of total line item value
Rows
CARP-FNC: Carpenter – Finish, Trim/Cabinet
CARP-FRM: Carpenter – General Framer
CARP-MECH: Carpenter – Mechanic
CLN: Cleaning Technician
CLN-F: Floor Cleaning Technician
CNC: Concrete Mason
DMO: Demolition
DRY: Drywall Installer/Finisher
ELE: Electrician
EQU: Equipment Operator
FLR: Flooring Installer
HDW: Hardware Installer
HVC: Heating / A.C. Mechanic
INS: Insulation Installer
LBR: General Laborer
MAS: Mason Brick/Stone
PLA: Plasterer
PLM: Plumber
PNT: Painter/Wallpaperer
RFG: Roofer
SDG: Siding Installer
STL: Steel Worker
STU: Stucco Installer
SUB: Non Labor item
TIL: Tile/Cultured Marble Installer

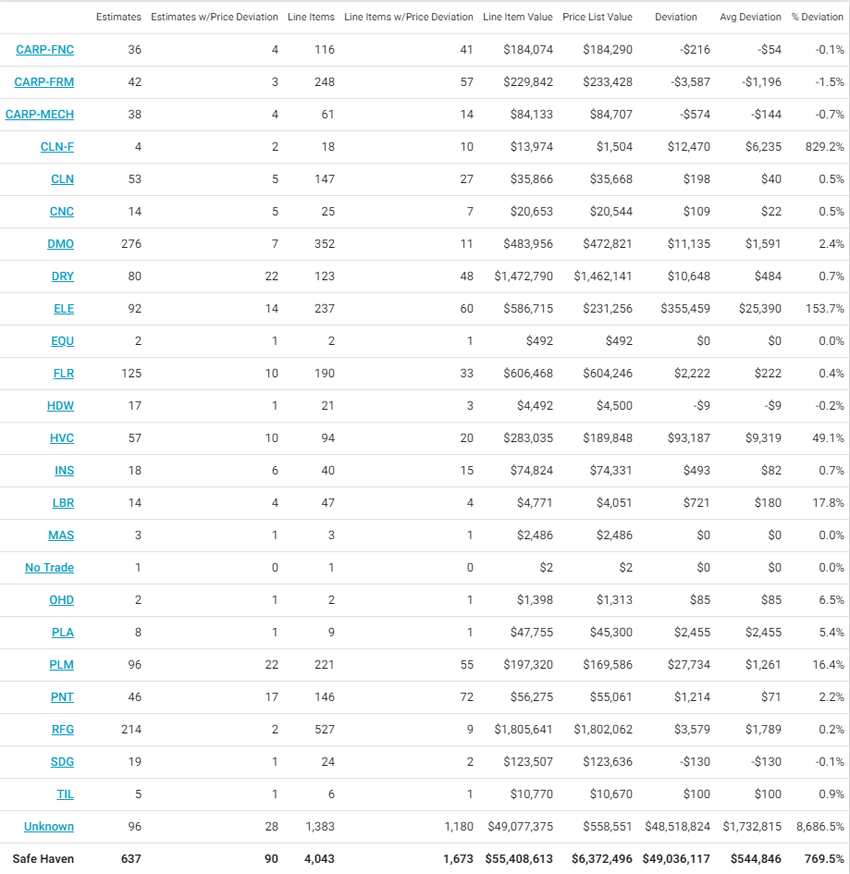
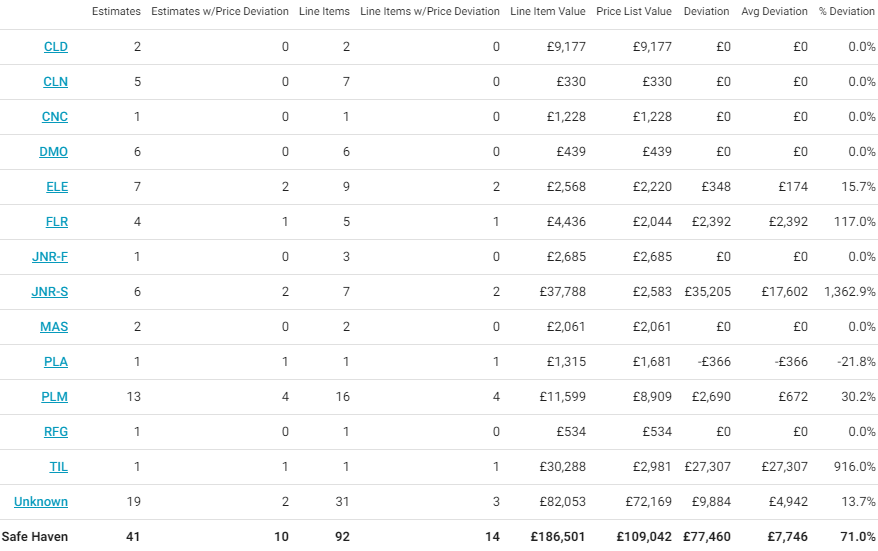
Percentage Deviation of Estimate by Trade
This report displays the percentage deviation of estimate prices from price list prices, by trade category, helping you ensure that estimate prices are accurate. This report also shows the number of estimates, number of line items, estimate value, value of deviating line items, average estimate deviation, and percent overall deviation.
- Select a bar in the graph or a trade category in the table to see data for other levels of your hierarchy, including individual estimates.
- Hover over bars in the graph to see the value of the deviations.
Percentage Deviation of Estimate by Trade graph
This graph displays the percentage deviation of estimate prices from price list prices, by trade category.

Percentage Deviation of Estimate by Trade table
Columns
Estimates: Number of estimates
Estimates w/Price Deviation: Number of estimates with price deviations
Line Items: Number of line items
Line Items w/Price Deviation: Number of line items with price deviations
Line Item Value: Total value of line items from estimates
Price List Value: Total value of line items from the price list
Deviation: Total value of deviations (Line Item Value - Price List Value)
Avg Deviation: Average value of deviations per estimate (Deviation / Estimates w/Price Deviation)
% Deviation: Percentage of deviation from the price list value
Rows
CARP-FNC: Carpenter – Finish, Trim/Cabinet
CARP-FRM: Carpenter – General Framer
CARP-MECH: Carpenter – Mechanic
CLN: Cleaning Technician
CLN-F: Floor Cleaning Technician
CNC: Concrete Mason
DMO: Demolition
DRY: Drywall Installer/Finisher
ELE: Electrician
EQU: Equipment Operator
FLR: Flooring Installer
HDW: Hardware Installer
HVC: Heating / A.C. Mechanic
INS: Insulation Installer
LBR: General Laborer
MAS: Mason Brick/Stone
PLA: Plasterer
PLM: Plumber
PNT: Painter/Wallpaperer
RFG: Roofer
SDG: Siding Installer
STL: Steel Worker
STU: Stucco Installer
SUB: Non Labor item
TIL: Tile/Cultured Marble Installer
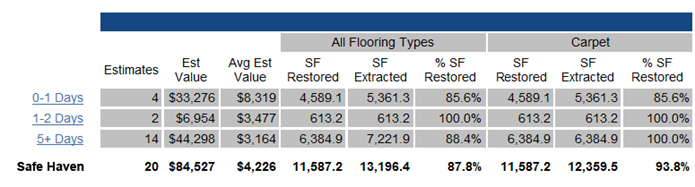
Restored Flooring
This report displays the percentage and value of flooring (carpet, tile, vinyl and wood) that was salvaged, by the number of days it took to receive the job. The restored percentage is derived from information entered for each water extraction item in Xactimate. This report helps you see the correlation between time and the value of flooring that can be salvaged in a flood situation.
- Select a plot point in the graphs or a link in the table to see data for other levels of your hierarchy, including individual estimates.
Restored Flooring graphs
The graphs display the percentage of flooring (all, carpet, vinyl, wood, and ceramic tile) that was salvaged, based on how quickly the estimates were received. For example, in this graph, estimates received later had less flooring salvaged.
Restored Flooring table
Columns
Estimates: Number of estimates
Estimate Value: Total value of estimates
Average Estimate Value: Average estimate value (Est Value / Estimates)
Columns for each flooring type (All, Carpet, Ceramic Tile, Vinyl, and Wood)
SF Restored: Total square feet restored
SF Extracted: Total square feet extracted
% SF Restored: Percentage of total square feet restored
Rows
Number of days to receive assignment
Restored Flooring table
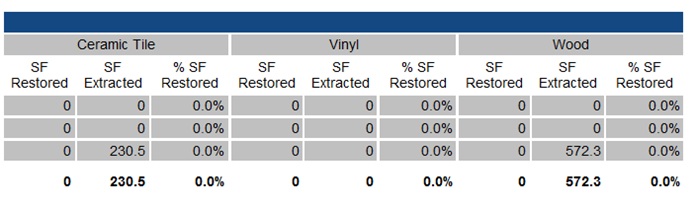
Restored Flooring table, continued
Salvageable Flooring
This report displays the percentage and value of flooring (carpet, tile, vinyl, and wood) that was salvaged, by the number of days it took to receive the job. The restored percentage is derived from information entered for each water extraction item in Xactimate. This report helps a company see the correlation between time and the value of flooring that can be salvaged in a flood situation. Select a plot point in the graphs or a link in the table to see data for other levels of a company’s hierarchy, including individual estimates.
Percentage of Flooring Salvaged graph
This line graph display the percentage of flooring that was salvaged based on how quickly the estimates were received.
Salvageable Flooring table
Columns
Estimates: Number of estimates
Estimate Value: Total value of estimates
SF Removal: Total square feet of flooring removed
$ Removal: Total value of flooring removed
SF Extraction: Total square feet of flooring extracted
$ Extraction: Total value of flooring extracted
SF Salvaged: Total square feet of flooring salvaged
% SF Salvaged: Percentage of affected flooring that was salvaged
Rows
Number of days to receive assignment: 0–1 Days, 1–2 Days, 2–3 Days, 3–4 Days, 4–5 Days, or 5+ Days
Top 20 Causes of Loss
This report displays the 20 causes of loss that contain the highest estimate value for a given data set or hierarchy. The Other total includes all categories that are not part of the 19 categories appearing in the report. Lower hierarchy levels may have causes of loss that vary from these categories, so fewer categories may be displayed. Select a bar in the graph or a price list category in the table to see data for other levels of a company’s hierarchy, including individual estimates.
Average Value by Cause of Loss graph
This bar graph displays the average value by cause of loss for each top 20 price-list category.
Top 20 Causes of Loss table
Columns
Estimates: Number of estimates
Total Estimate Value: Total estimate value of all estimates in with this cause of loss
Total ACV: Total Actual Cash Value (or the money equal to the cost of replacing lost, stolen, or damaged property after applying depreciation) of all the estimates with this cause of loss
Total Net Claim: The total cash estimate of the claims minus the total deductible amounts
Avg Estimate Value: Average estimate value (Total Estimate Value / Estimates)
% of Total Estimates: The percent of all estimates in the data set with this cause of loss (Number of claims with this cause of loss / Total number of claims)
% of Total Value: The percent of the total value of all estimates in the data set with this cause of loss (Total value of claims with this cause of loss / Total value of all claims)
Rows
Cause of loss categories: Collapse, Fire, Frozen Pipe, Hail, Water Heater, etc (Select the Components link to see individual items used to categorize the estimates)
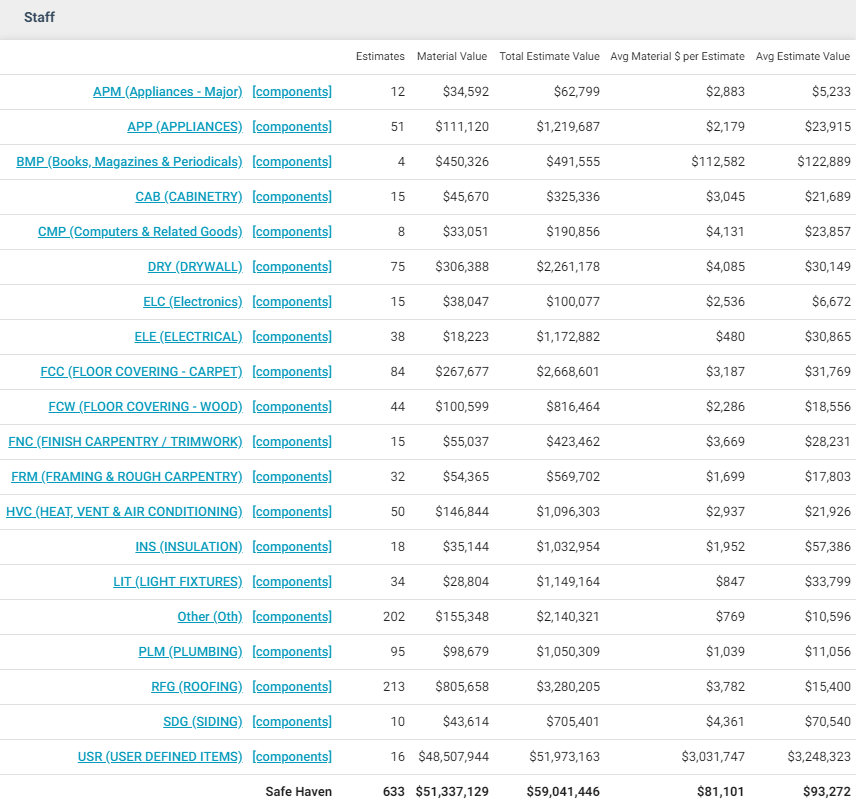
Top 20 Material Categories
This report displays the 20 price list categories that contain the highest value of materials for a given data set or hierarchy. The Other total includes all categories that are not part of the 19 categories appearing in the report. Lower hierarchy levels may have material values that vary from these categories, so fewer categories may be displayed. This report helps you see which materials are most and least used.
- Select a bar in the graph or a price list category in the table to see data for other levels of your hierarchy, including individual estimates.
- Select a components link in the table to see individual items used to categorize the estimates.
Material Value by Category graph
This graph displays the average material value for each top 20 price list category.
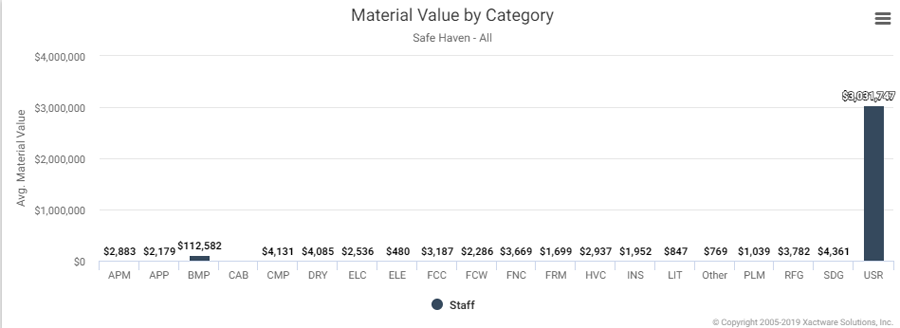
Top 20 Material Categories table
Columns
Estimates: Number of estimates
Material Value: Material value
Total Estimate Value: Total estimate value
Avg Material $ per Estimate: Average value of material per estimate (Material Value / Estimates)
Avg Estimate Value: Average estimate value (Total Estimate Value / Estimates)
Rows
Price list categories (Select a components link to see individual items used to categorize the estimates).