Coverage Areas
Use Coverage Areas to view the number of qualified contractors available for a data set and/or job type in a specific geographic area.
The screen shots in this document are generic, and your company’s interface may vary.
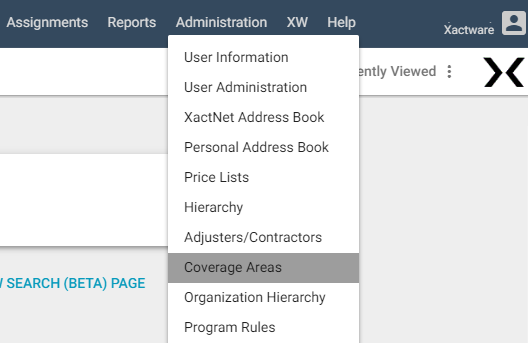
- Click Coverage Areas from the Administration menu.
- Select a data set containing qualified adjusters or contractors in the Data Set menu.
- Select a job type from the Job Type menu.
- The United States is displayed by default. Click Switch to Canada to switch to a map of Canada. The map is color-coded by the number of contractors available.
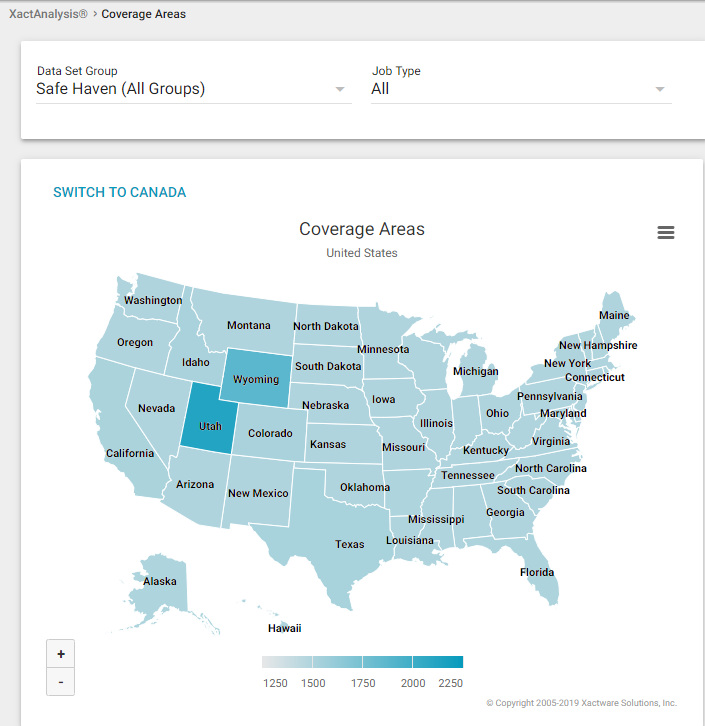
- Hover over a state or province to view the number of contractors in the geographic area. Click the state/province to drill down to a state/province, county, or ZIP/postal code level, and continue doing so until you arrive at the smallest geographic area you want to view.
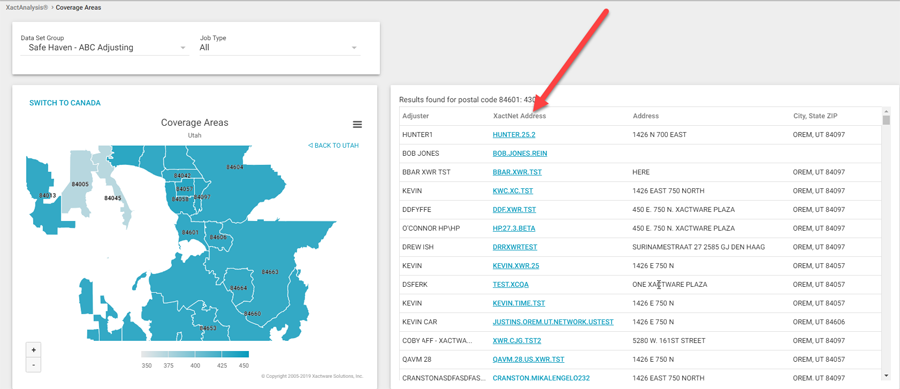
- Once you are at the smallest geographic area, a list of adjusters/contractors, their XactNet Addresses, physical addresses, and geographic locations are displayed to the right of the map. Click the XactNet Address of an adjuster to view the Adjusters/Contractors module, where you can qualify adjusters and contractors to receive assignments via XactAnalysis.
- Click the More Options icon
 to print the chart or download a PNG or JPG image of the chart.